
Drawing with Nothing: Exploiting aliasing and moire patterns to draw for you
Exploiting aliasing during image resizing to make shapes and 3D objects appear via Moiré patterns. Essentially a writeup behind Interference and a follow-up on my moire patterns post.
Quite a while back I posted some experiments on drawing with Moire Patterns. When resizing an image, the screen attempts to display the image with a lower resolution and has to interpolate across pixels in the original image to determine the new pixel colours. This creates Moire Patterns, interference patterns that can magnify tiny but global “aberrations”. I've previously used Moire Patterns to measure stuff like Threads Per Inch and screen resolution. It turns out that it's possible to draw anything using these Moire Patterns, and in fact, encode 3D information within.
Some Math
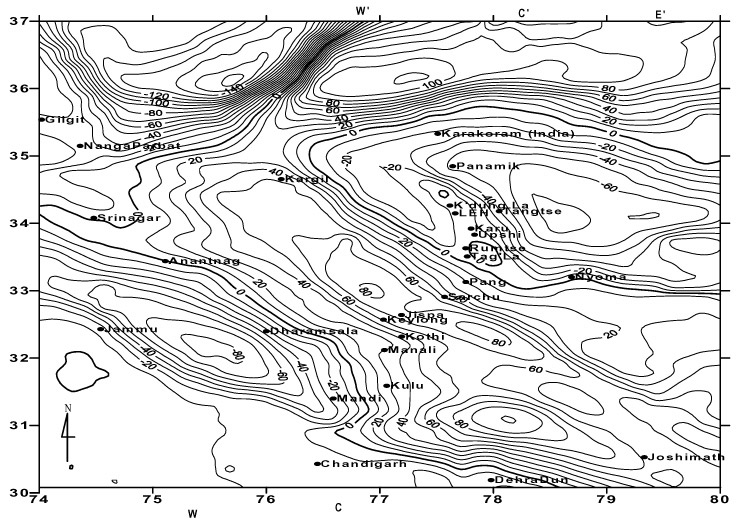
I model Moire Patterns as a bunch of non-intersecting lines, and a convenient way to model such a thing is a continuous heightmap $f: \mathbb{R}^2 \rightarrow \mathbb{R}$. The lines $L_h(h)$ are then contours of this heightmap, i.e, satisfying $L_f(h) = \lbrace(x,y) \in \mathbb{R}: f(x,y) = h\rbrace$. You've seen contours in topological maps before, like this of the Himalayas:
It turns out continuous height maps are great for modeling Moire Patterns too. Take two heightmaps $f,g: \mathbb{R}^2 \rightarrow \mathbb{R}$, and consider the set of contour lines $F = \lbrace L_f(i): i \in \mathbb{Z}\rbrace$ and $G = \lbrace L_g(i): i \in \mathbb{Z}\rbrace$. As discussed in my previous post, Moire Patterns appear as an “illusionary” curve that connects points of intersection between two patterns.
We can hence model the Moire Patterns $M(f,g) = \lbrace L_{h}(i): i \in \mathbb{Z}, \; h(x,y) = f(x,y) - g(x,y) \rbrace$, where each $i \in \mathbb{Z}$ describes a curve that cuts through a subset of the intersecting points. Curves described by $M(f,g)$ models Moire Patterns well because they are somewhat independent of the “level of detail” chosen. E.g., here I'm choosing to pick $i \in \mathbb{Z}$, but the height map which $M(f,g)$ is describing via contours will remain the same if I choose to pick $i$ twice as frequently $i \in \frac{1}{2} \mathbb{Z}$.
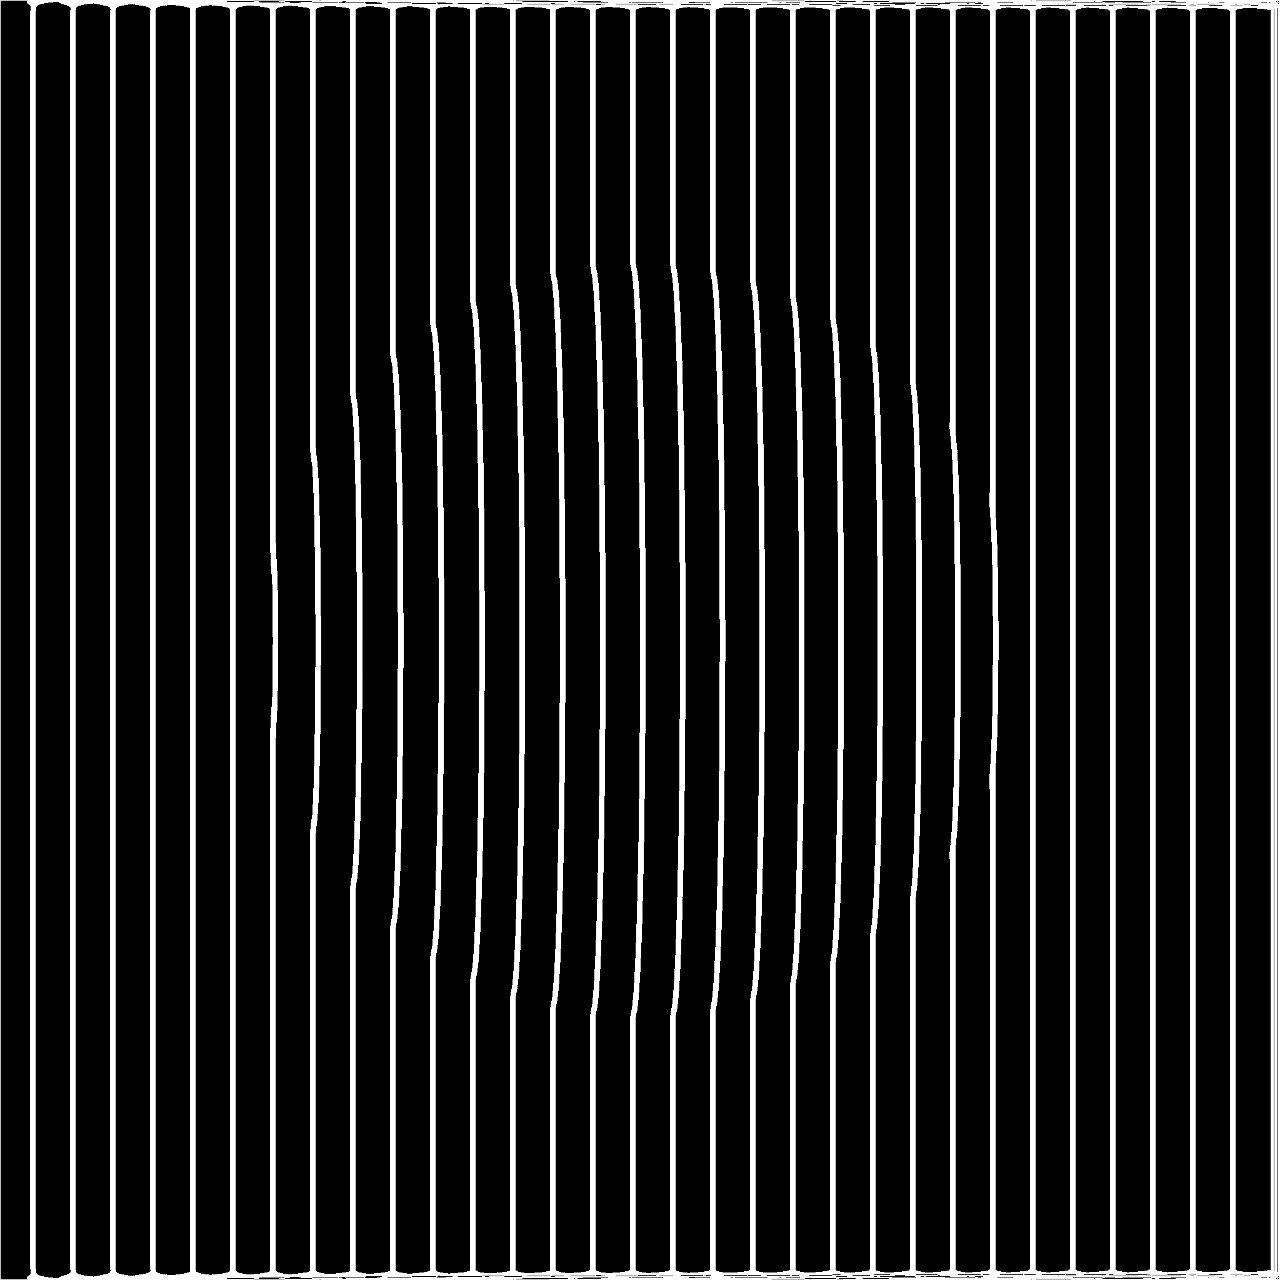
In the case of resizing images, the pixel aliasing interpolates pixels of an image, resulting in slight discolouration across pixel boundaries. This forms a grid-like pattern, and for this post, I mainly focus on the vertical lines of this grid-like pattern. This pattern can be modeled by the height map $p(x,y) = kx$ for $k \in \mathbb{R}$, where $k$ is dependent on the original and final resolution of the image.
If I wanna draw the contour $f(x,y)$ when I rescale my image and display it in a particular resolution, I'd have to compute $k$, and plot the contours of the heightmap $h(x,y) = f(x,y) - kx$.
When plotting the contours, the width of the lines drawn is crucial to the effect. Naively, for plotting $L_f(h)$ one can colour a pixel at position $(x,y)$ if $\vert f(x,y) - h\vert < \epsilon$, where $\epsilon$ controls the line's thickness. This works for the most part except when $\nabla f$ varies a lot throughout the height map.
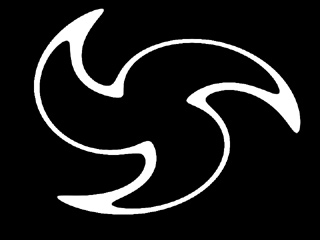
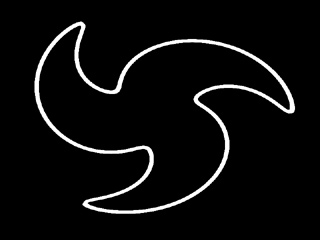
In the example above by Inigo Quilez, the lines at the edges of each “blade” are thicker, due to $\nabla f$ being smaller at those points. A better way would be to colour a pixel at position $(x,y)$ if $\left \vert \frac{f(x,y) - h}{\nabla f(x,y)} \right \vert < \epsilon$, resulting in the following plot:
Drawing!
To draw something, we need to construct a continuous height map $f: \mathbb{R}^2 \rightarrow \mathbb{R}$ where one of the contours, say $f(x,y) = 0$, draws what we want. We can then plot the contours of $f(x,y) - kx$. The drawing can be represented as a 2D boolean array $D[\cdot, \cdot]$, where white ($1$) pixels are part of the drawing and black ($0$) isn't. The hard part is constructing an appropriate height map from this target drawing.
Well, an appropriate height map can be the Signed Distance Function $\mathrm{SDF}: \mathbb{R}^2 \rightarrow \mathbb{R}$, the shortest distance a position is from a white pixel:
Computing the $\mathrm{SDF}$ can be done via the Fast Marching Method, with $\vert\nabla u\vert = 1$, and luckily, there's a Python implementation of the Fast Marching Method.
With this technique, I made the video at the start of this post and the one below, drawing Alula from Oneshot. You might have to view the video in full screen to avoid additional aliasing from a small display.
3D?
Aren't we already working with height maps? Is there a way to draw a 3D surface with Moire Patterns? If you thought that the first video looked awfully 3D, that is no coincidence. As an image gets smaller, the vertical pattern induced by pixel aliasing grows wider relative to the image. This decreases the value of $k$ in our plot of the contours of $f(x,y) - kx$. Say we focus on one of the contours: $\lbrace (x,y) : f(x,y) - kx = 0\rbrace$. Then the resulting curve can be thought of as a slice of the height map $f(x,y)$, and as $k$ changes, we are viewing different slices of the height map.
With that, I hacked a simple raytracer to compute the depth map of a scene:
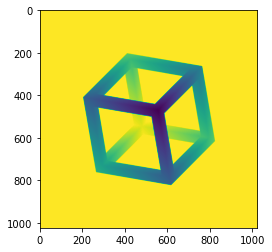
And now I can plot any 3D object! Here's a sphere:
And the face vase illusion thingy: