
Visualising Homomorphisms
Visual intuitions I've accrued while studying algebra, starting with a geometric interpretation of the isomorphism theorems and application into more “involved” concepts like composition series. Currently very Group focused, might update for more objects.
Motivation
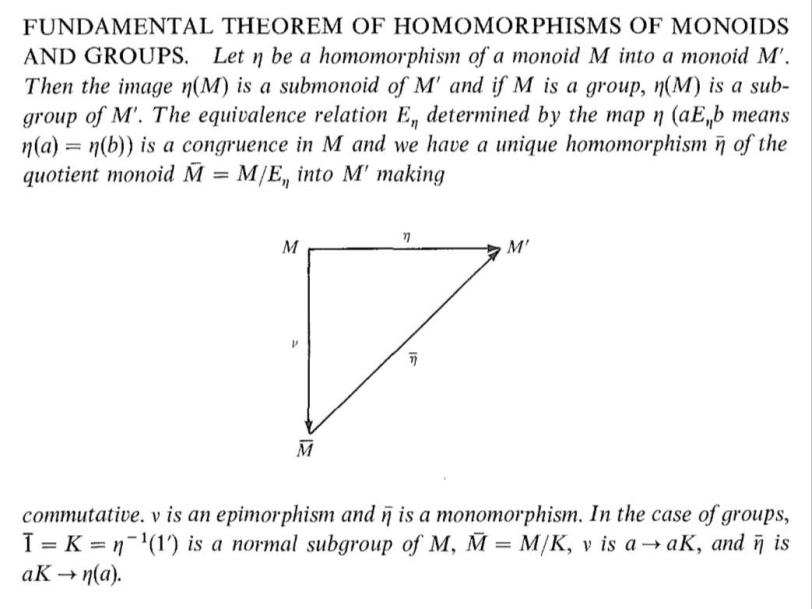
So I started learning abstract algebra from Basic Algebra I by Nathan Jacobson earlier this year, and being a rather dense resource it lacked any form of discourse on the intuition of the concepts. For instance, here's how I got introduced to homomorphisms from Nathan Jacobson:
Despite having been given no intuition, I formed my own visual intuition of certain concepts, and relied upon it up till Galois Theory. And then I lost interest.
Fast forward to a few months later I got recommended The Dummit and Foote which is an easier resource with plenty of intuition discussed. However, having formed my own intuition already, I realised the intuition written there had some shortcomings, but it helped in fixing certain issues in my intuition and is really an amazing and clear resource.
AND THEN I saw this neat little visual on the Snake Lemma from Puzzling Through Exact Sequences and that motivated me to “concretise” my visual intuitions. Turns out my intuition is a generalisation of the intuition presented in Puzzling Through Exact Sequences.
Here, I'm going to describe the intuitions I've been using, starting from the most “concrete” and building up to those more “abstract”, and demonstrate its explainability power in some examples, and as a treat, specialise this intuition for abelian groups to connect my interpretation with that from Puzzling Through Exact Sequences. This post is going to be very Groups focused but I'm sure there are ways to carry this to other structures like Rings. Will update this post when I get around to that.
This post is going to be VERY non-rigourous and assume some familiarity with the algebra behind. The intention is not to introduce the concepts but to detail certain intuitions one might miss out on. I hope my writing can help out others who are just starting in Algebra ^-^*.
Intuitions
First Isomorphism Theorem
We start with some fairly standard visual intuition of the first isomorphism theorem, which states:
Let $G$ and $H$ be groups, and let $f : G \rightarrow H$ be an epimorphism and $K = \text{ker}\;f$. Then $K \trianglelefteq G$ and $H \cong G / K$.
The core claim here is that $G / K$ has “the same structure” as $H = \text{Im}\; f$. We build the visual intuition from the fact that $G$ is evenly partitioned by the cosets of $K$, and that $G / K$ is precisely the “structure” of these cosets.
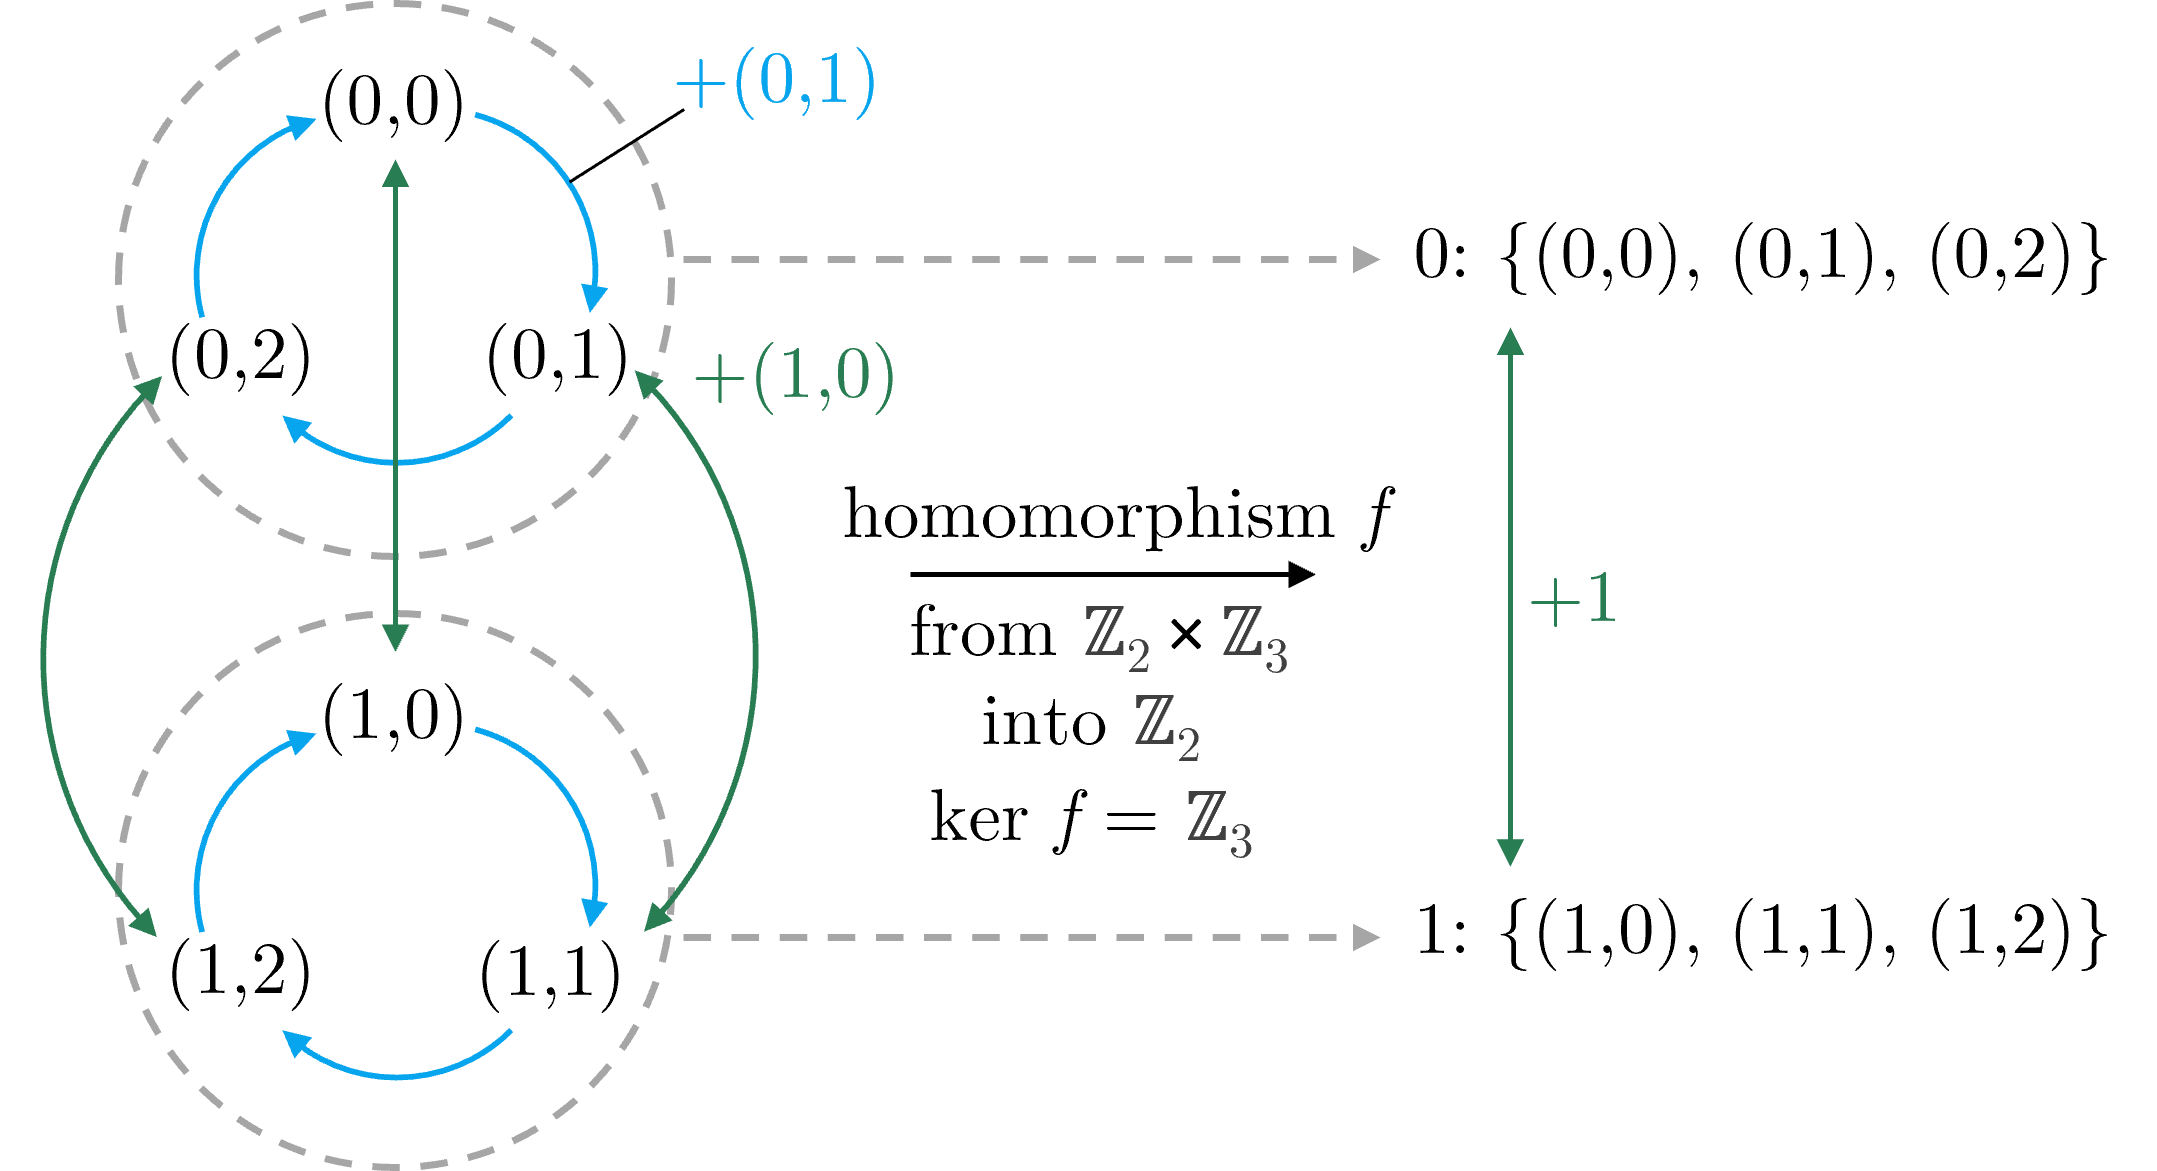
The visual here shows the group $G = \mathbb{Z}_2 \times \mathbb{Z}_3$, with two generators $(0,1)$ and $(1,0)$. The orange arrows correspond to adding $(0,1)$ and the pink arrows correspond to adding $(1,0)$. We have an epimorphism $f$ to $\mathbb{Z}_2$ with kernel $K = \mathbb{Z}_3$.
From the visual, we can see that an epimorphism collapses the kernel $K$ into a single point in the image $G / K$. All the other cosets of $K$ in $G$ are similarly collapsed into a unique point in $G/K$. Some properties become immediately apparent, such as Lagrange's Theorem ($|G / K| = |G|\,/\,|K|$ for finite $G$), as each point in $G / K$ is “made up” of $|K|$ elements in $G$. Furthermore, the collapsing of the cosets into single points reveals some structure of $G$: The pink arrows on the right side of the visual, indicative of the structure of $G/K$, corresponds to the three pink arrows on the left side. More generally, the group operation on $G$ is well-defined over the cosets of $K$.
Collapsing some structure (that of $\text{ker}\;f = K$) into a single point begets the intuition that some structural information is lost upon a homomorphism $G \rightarrow G /K$ (in particular, a non-injective homomorphism) while retaining some information about the original structure (The pink arrows on the right side of the visual): We are “collapsing” off some part of the structure to obtain the image of a homomorphism. This, I presume, is the origin of the term “quotient” and why its syntax bares resemblence to “dividing”.
The First Isomorphism Theorem is also often stated with the following:
For every normal subgroup $K$ of $G$, there is an epimorphism $f: G \rightarrow G / K$. (Via the first isomorphism theorem, this requires that $\text{ker}\;f = K$). Such an epimorphism can simply be the natural epimorphism of $g \in G$ into its coset $gK \in G/K$.
Hence, when studying homomorphisms, we are also studying normal subgroups. This visual can therefore also serve as intuitions about normal subgroups.
Unfortunately this visual intuition is very limited. It is difficult to see what exactly I mean by “collapsing”. What was removed and what is left? The idea of “collapsing” the structure of $G$ will be made more explicit in the Lattice Isomorphism Theorem where we'll see a more common (and useful) way to visualise homomorphisms.
Lattice Isomorphism Theorem: Collapsing the Lattice
The Lattice Isomorphism Theorem as stated by itself is rather opaque:
(Dummit and Foote) Let $G$ be a group and let $N$ be a normal subgroup of $G$. Then there is a bijection from the set of subgroups $A$ of $G$ which contain $N$ onto the set of subgroups of $G / N$, given by the map $A \rightarrow A/N$. In particular, every subgroup of $G/N$ is of the form $A/N$ for some subgroup $A$ of $G$ containing $N$ (namely, its preimage in $G$ under the natural projection homomorphism from $G$ to $G/N$). This bijection has the following properties: for all $A,B \le G$ with $N \le A$ and $N \le B$,
- $A \le B$ iff $A/N \le B/N$
- If $A \le B$, then $[B:A] = [B/N : A/N]$
- $\langle A,B \rangle / N \cong \langle A/N, B/N \rangle$
- $(A \cap B)/N \cong A/N \cap B/N$
- $A \trianglelefteq G$ iff $A/N \trianglelefteq G/N$
The “involved-ness” of this theorem is largely because it essentially formalises a way to visualise quotients by slicing the Lattice of Subgroups. Dummit and Foote goes through in detail the visual implications of the Lattice Isomorphism Theorem on the Lattice of Subgroups. Since the visual intuition I'll present in the next section essentially builds on the intuition presented in Dummit and Foote, for completeness I'll touch a little on this.
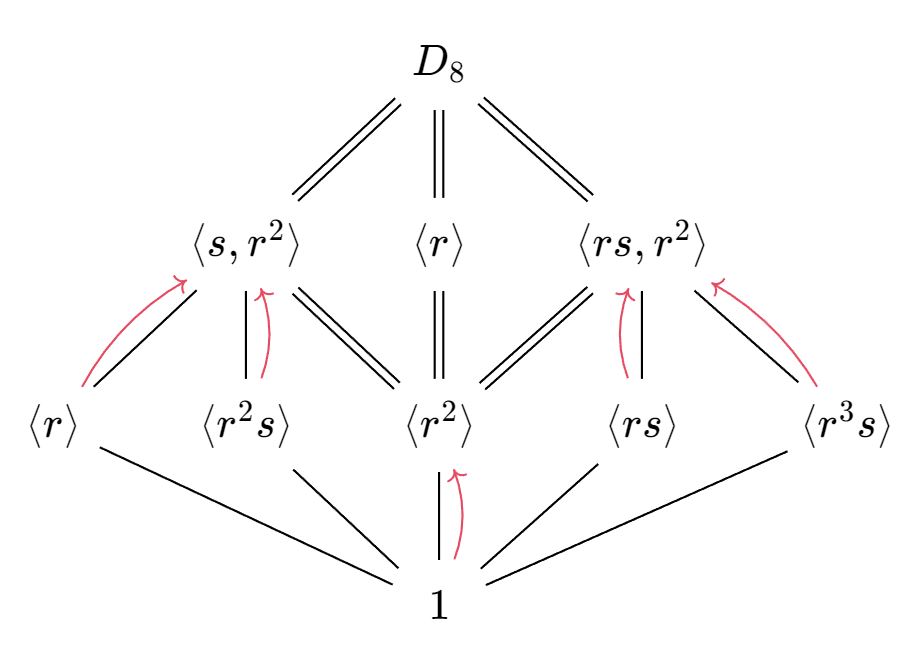
First off, the Lattice of Subgroups of a group $G$ can be seen to encode the structure of $G$. For illustration purposes I'll be using the (finite) Dihedral Group $D_8$ as an example:
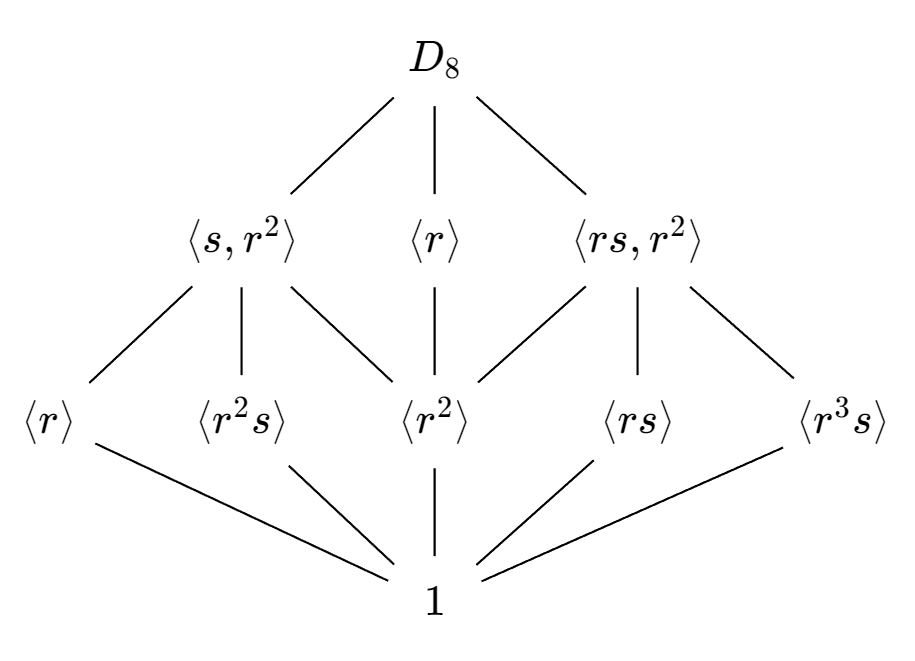
Each line that connects two groups indicates inclusion, i.e., one is a subgroup of another (e.g., $\langle r^2 \rangle < \langle r \rangle$). Do note that while “the shape” of the lattice encodes the structure of the group, a particular “shape” is by no means unique to a subgroup (e.g., take the lattice for $\mathbb{Z}_2$ and $\mathbb{Z}_3$, which consists of a single line connecting $1$ to itself).
The Lattice Isomorphism Theorem gives an intuition for taking quotients by collapsing the lattice diagram. Say for insance we take $K = \langle r^2 \rangle$ and consider the lattice for $G / K = D_8 / K$. (you do first need to check that $\langle r^2 \rangle \trianglelefteq D_8$ in order for the quotient to be well-defined):
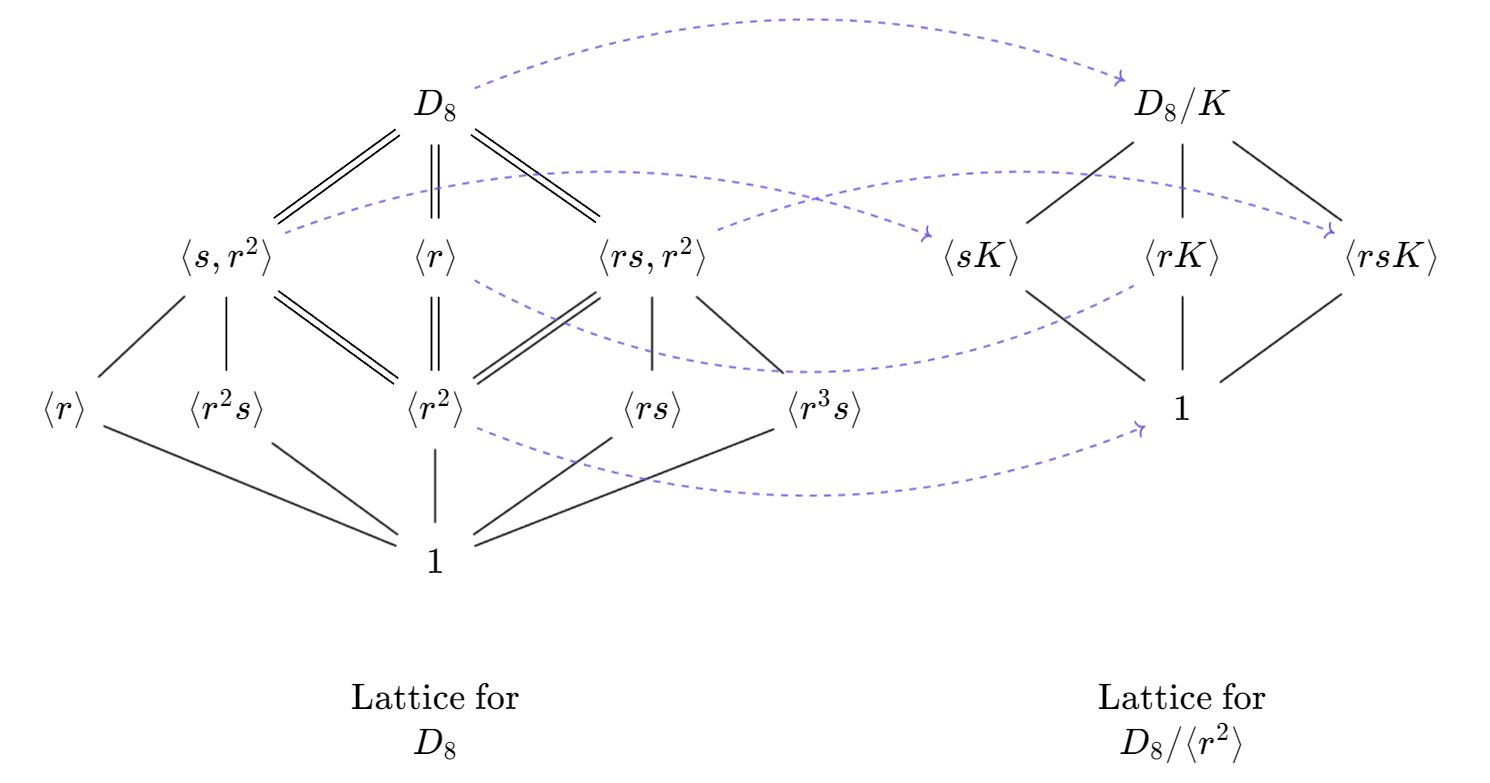
Visually we can see that the lattice for $D_8 / K$ has the exact same shape as a “subgraph” of the lattice for $D_8$. In fact, it is everything above the quotient $K$. The Lattice Isomorphism Theorem gives an explicit description of this visual similarity. E.g., it justifies the yellow lines in the image: All groups in $G$ that contain $K$ gets uniquely mapped to a subgroup in $G/K$. In particular, $K$ is mapped to the identity in $G/K$. One can also check that the Lattice Isomorphism Theorem shows that inclusion relations of the “subgraph” in $G$ has the “same shape” as that of $G/K$. In fact, the fifth statement describes something even more that I didn't depict in the visual above: If an inclusion relation is that of “normality” ($A \triangleleft B$) in the lattice of $G$, its corresponding inclusion relation in the lattice of $G/K$ is also that of “normality” ($A/K \triangleleft B/K$).
What about the other subgroups of $G$? In particular, those that don't contain $K$? Where do they get mapped to? Well certainly if $C \le K$, $C$ gets mapped to identity in $G/K$. As for the other groups $D$ (that don't contain $K$) its image under the natural homomorphism from $G \rightarrow G/K$ is the same as the image of the subgroup $DK \le G$; and we have $K \le DK$! This means such a subgroup $D$ gets mapped into one of the subgroups of $G/K$. Visually we have something like this:
This visual intuition is certainly incredibly powerful. We see lattice diagrams in proofs with a fair amount of parts such as in Lang's proof of the Butterfly Lemma as a way to understand how every part interacts together, which is a testament to its explainable power. However, I have some issues with this intuition as I still found it quite limiting.
Shortfalls of the lattice visual intuition
To illustrate some of the shortfalls, let's try to use lattices to visualise the other isomorphism theorems:
Diamond Isomorphism Theorem:
Let $G$ be a group and let $A$ and $B$ be subgroups of $G$, and assume $A \le N_G(B)$. Then $AB$ is a subgroup of $G$ and $B \trianglelefteq AB$, $A \cap B \trianglelefteq A$ and $AB / B \cong A / A\cap B$.
We can illustrate the Diamond Isomorphism Theorem in “lattice-speak” as such, where I've annotated normality $\triangleleft$ with a tiny slash through the line. A similar diagram is also given in Dummit and Foote:
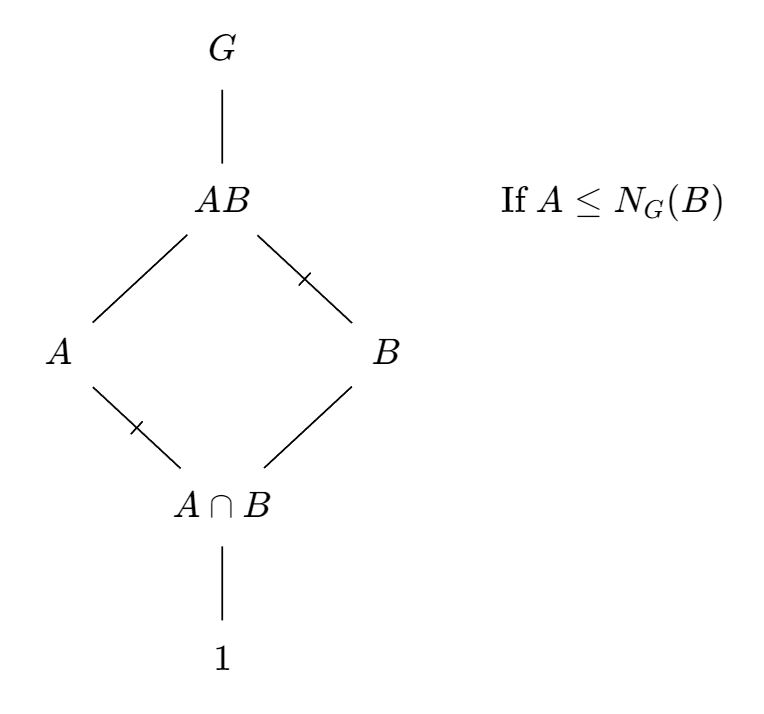
I have several issues with this lattice visual for the Diamond Isomorphism Theorem:
- Can you immediately “see” that $A \le N_G(B)$ implies
- $B \trianglelefteq AB$
- $A \cap B \trianglelefteq A$?
- Can you immediately “see” that $AB / B \cong A / A\cap B$? They sure look like pretty seperate parts of the diagram!
Next, let's go the deep end and attempt to illustrate the aesthetically pleasing Butterfly Lemma:
Butterfly Lemma:
Let $G$ be a group with subgroups $A$ and $C$. Suppose $B \triangleleft A$ and $D \triangleleft C$ are normal subgroups. Then
\[\frac{(A\cap C)B}{(A\cap D)B} \cong \frac{(A\cap C)D}{(B\cap C)D}\]And here's wikipedia's admittedly very pretty illustration of all the parts:
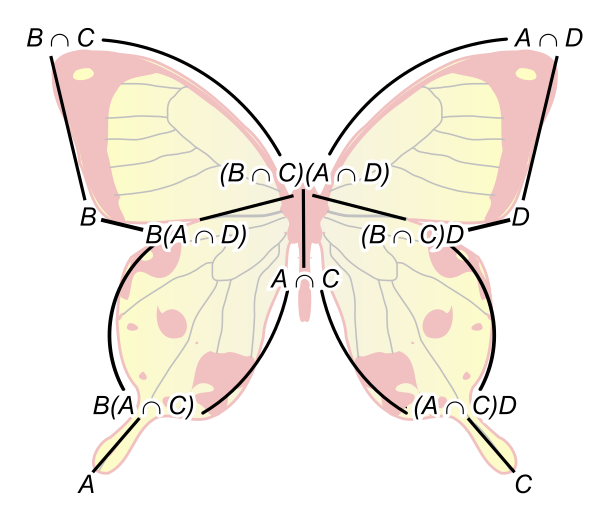
Again, are you able to immediately “see” that the isomorphism holds? It does feel like it popped out of nowhere doesn't it? How about the vaidity of taking quotients in the first place? (i.e., that $(A\cap D)B \trianglelefteq (A\cap C)B$ and $(A\cap C)D \trianglelefteq (B\cap C)D$). Furthermore the lattice diagram implies a TONNE of moving parts! But in reality we only have 4 objects of concern here ($A,B,C,D$)! The Butterfly Lemma with this current intuition is notoriously difficult to reason about for newbies, as a cursory search on math.stackexchange will tell you.
All in all, I feel the lattice visual suffers from the following core problems:
- Unable to illustrate other relations between subgroups
- How are $A$ and $N_G(A)$ related?
- How are $A,B$ and $A \cap B$ related?
- How are $A,B$ and $AB$ related?
- etc.
- Because we can't illustrate other relations apart from inclusion, we end up with a lot of disjoint parts in our lattice (e.g., we need to illustrate $A$, $B$, $A \cap B$ and $AB$ as seperate points in the lattice for the Diamond Isomorphism Theorem). This not only obscures how these are related, we might end up with so many parts to keep track of like in the Butterfly Lemma.
- Unable to visualise normality of subgroups, and hence the validity of taking quotients.
- Like sure we can annotate each line in the lattice to indicate normality, but what if $A \le B \le C$ and we want to illustrate that $A \trianglelefteq C$? (e.g., say $A$ is characteristic in $B$ and $B \trianglelefteq C$.)
Ngl being unable to visualise these connections kept bothering me, which motivated me to concretise a better way to visualise homomorphisms. My ideal visual intuition would make the isomorphism theorems look obvious, and have enough explainability power to visualise more involved concepts. SO LETS MAKE SOMETHING BETTER
Abstracting the Lattice: Slicing a Shape
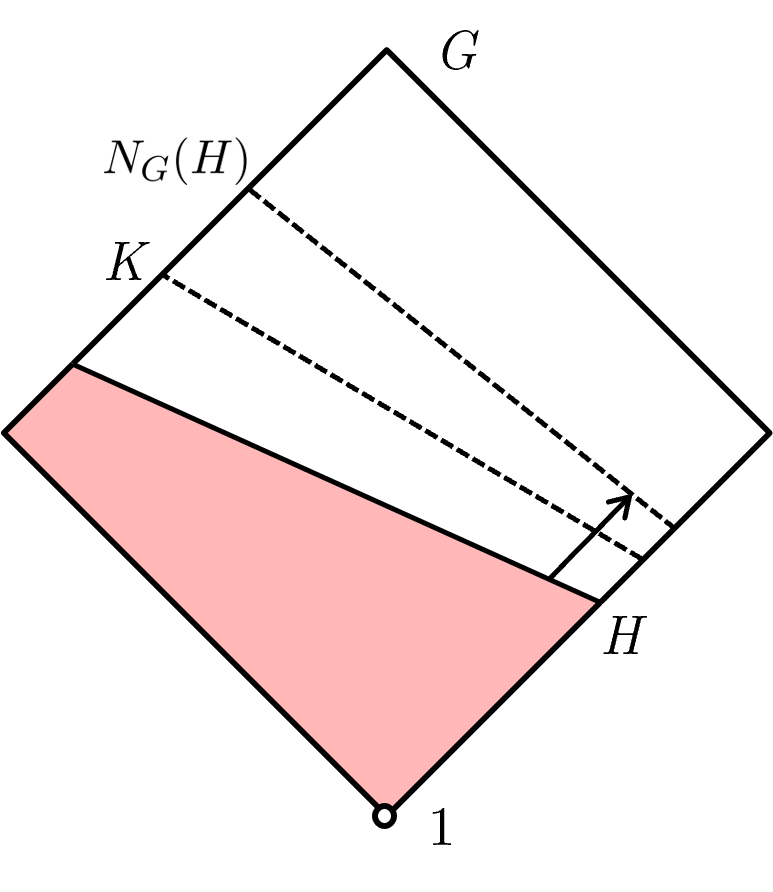
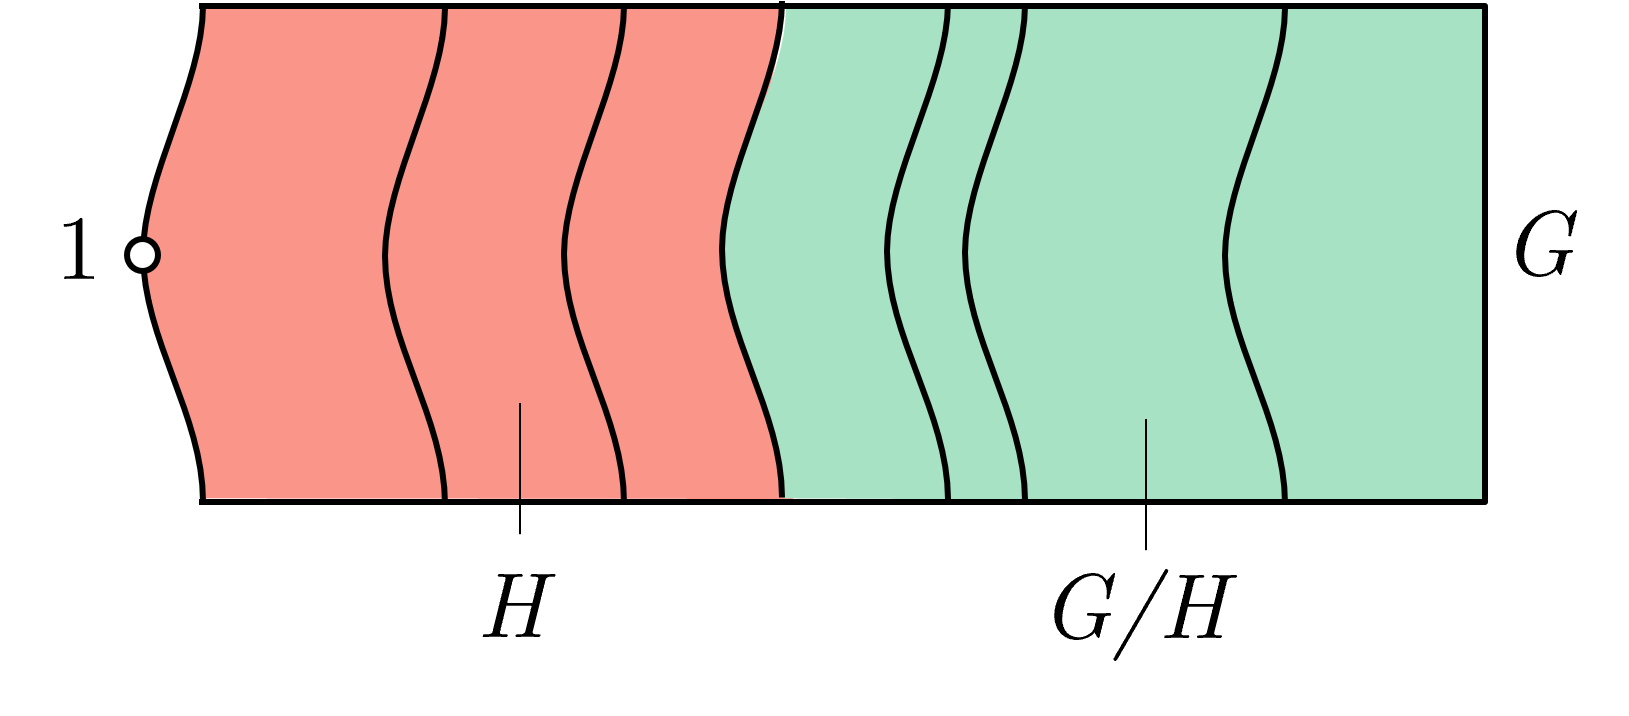
We abstract a group $G$ into a shape (I like to draw a diamond), and we'd like to express the inclusion relation $A \le B$ by having the shape of $A$ be inside the shape of $B$. Since every subgroup of $G$ contains the trivial subgroup $1$, we designate some point on the edge of $G$ to represent $1$, and we need all subgroups of $G$ to contain the point. We can hence represent a subgroup $H$ of $G$ as a slice of $G$, partitioning $G$ with a dashed line. When it is obvious which section $H$ has to be (say, since $H$ has to contain $1$), I'll just annotate the partitioning line.
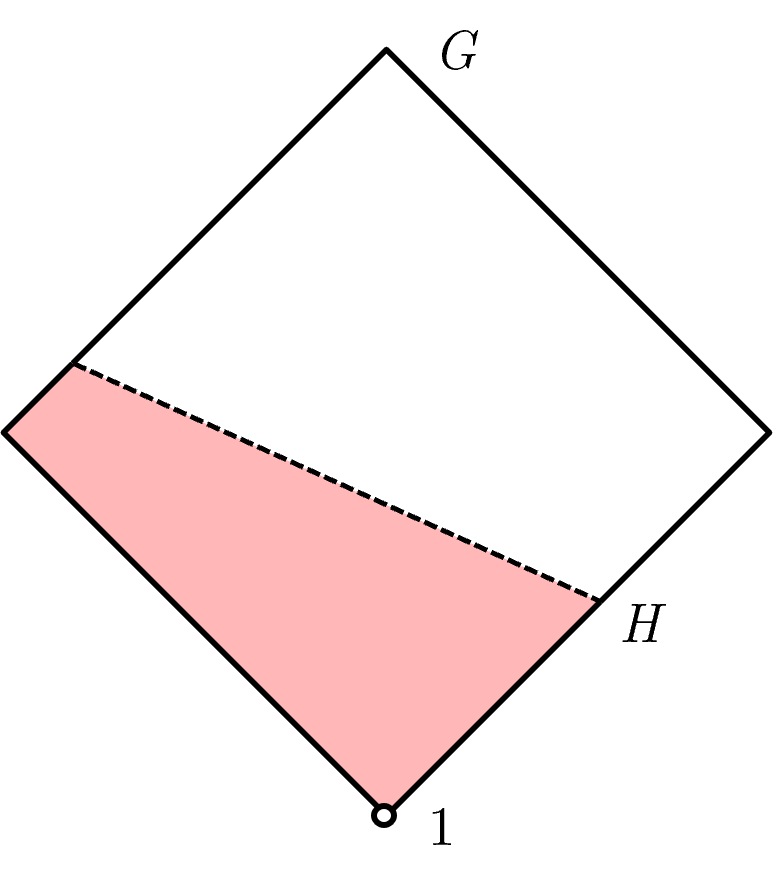
We can represent normal groups with a solid line with an arrow indicating its normaliser. This can be read as “$H$ is normal up to $N_G(H)$”. The arrow indicates whether it is valid to take quotients. For instance $N_G(H) / H$ is well-defined as $H$ is normal in $N_G(H)$. Similarly, $H \le K \le N_G(H)$ and so $H$ is normal in $K$ and hence $K/H$ is well-defined. Meanwhile, $G$, which the arrow doesn't extend all the way to, indicates that $H \not \trianglelefteq G$ and hence taking $G/H$ is not well-defined.
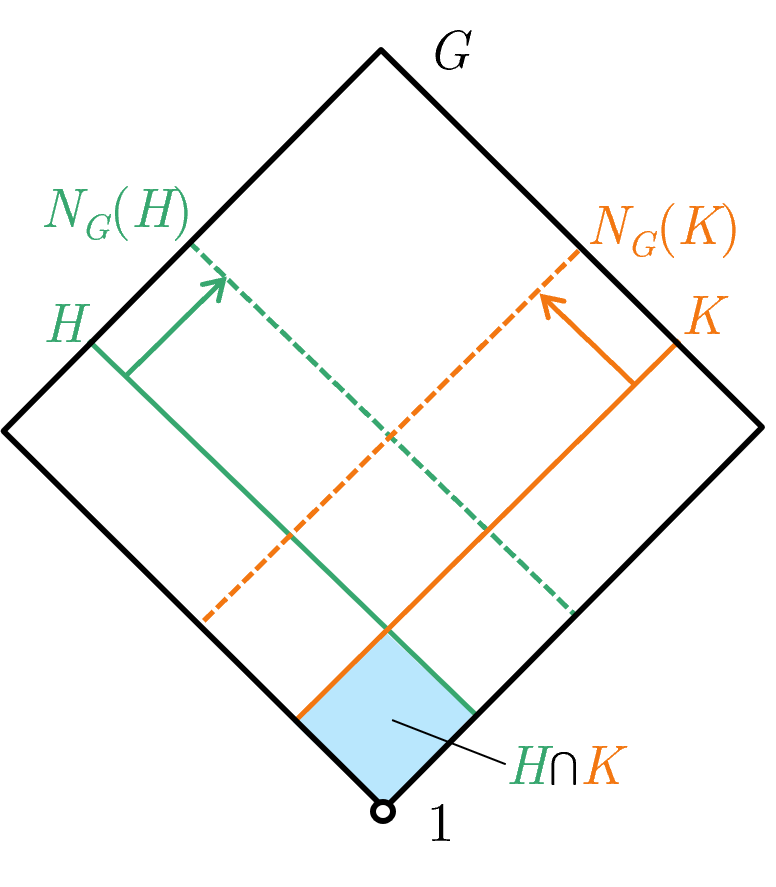
Now, we can visually represent $A \cap B$ as the intersection of both of their shapes. As an example, consider $H$ and $K$ be subgroups of $G$. $H \cap K$ is visually represented as the tiny coloured square at the bottom. Furthermore $H \cap K \trianglelefteq N_G(H) \cap N_G(K)$, which can be seen visually below as $N_G(H) \cap N_G(K)$ is within the domains specified by the two arrows ($H \cap K$ is defined by both the pink and blue solid lines, and is hence normal in anything within the domain bounded by both the pink and blue dashed lines). Visually we can also see that $H \cap K \trianglelefteq H\cap N_G(K)$ and $H \cap K \trianglelefteq N_G(H)\cap K$.
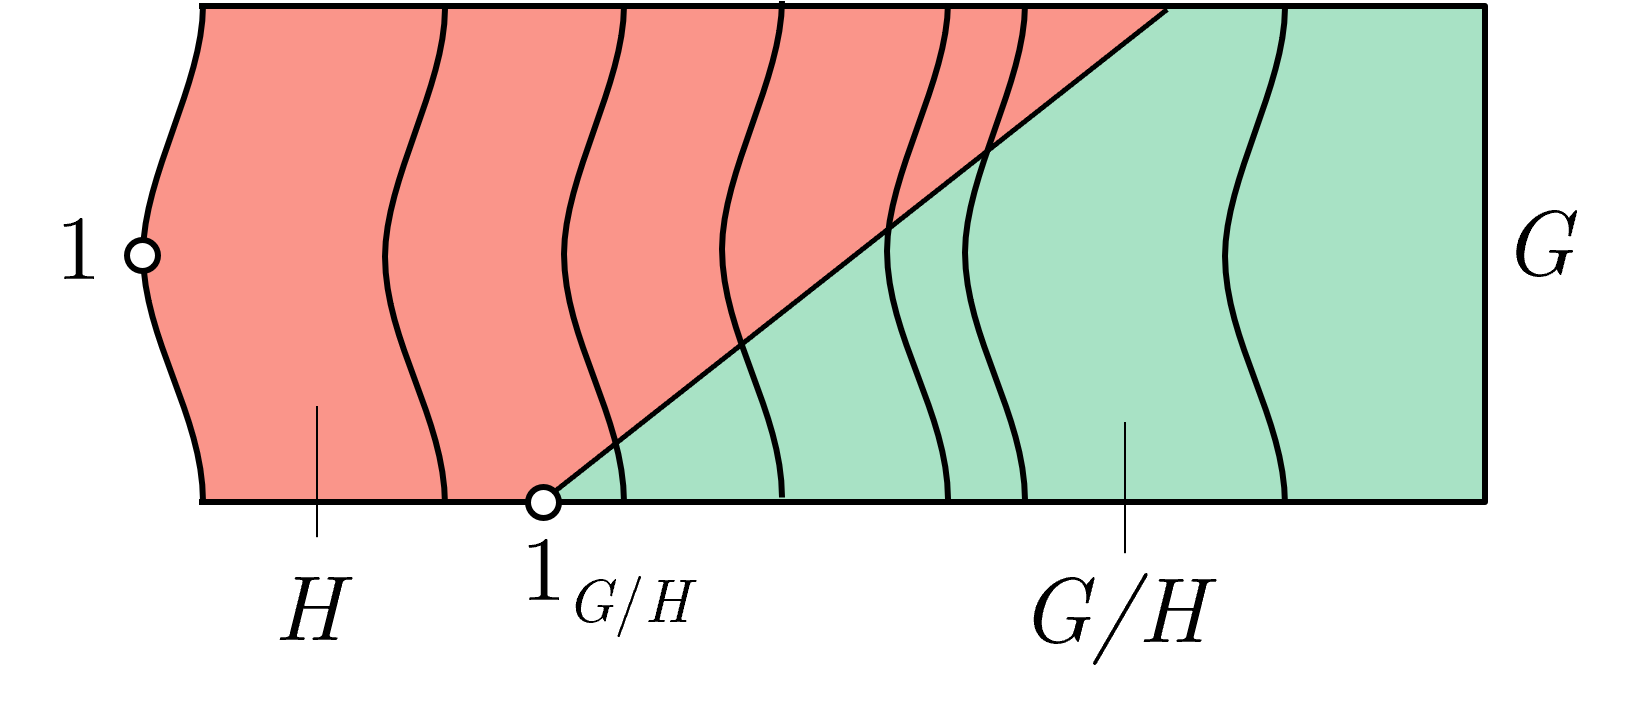
Now when we take quotients, we represent say $A/B$ with the difference in the shape $A$ and $B$, and the identity of $A/B$ to be any point along the line slicing $B$ from $A$ (as long as all subgroups of $A/B$ contain that point). So for instance, reusing the above image, say we have $H \le K \le N_G(H)$ (which implies $H \trianglelefteq K$). Then $H/K$ is well-defined and is represented visually as the coloured region below:
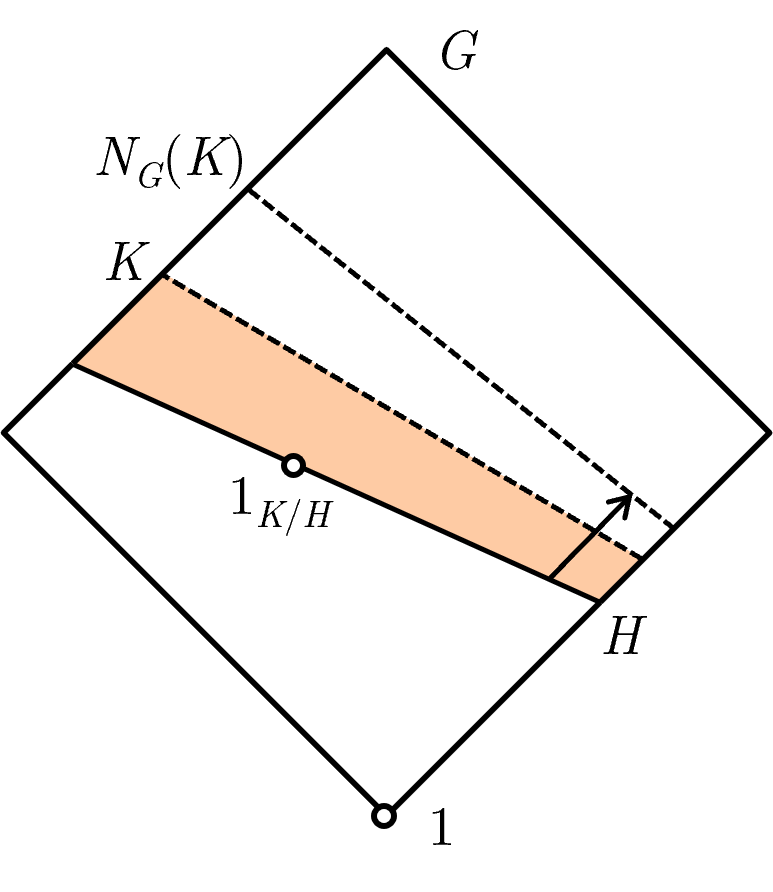
Visually we are able to see that $H/K$ is well-defined simply because we can visually see that $H \trianglelefteq K$.
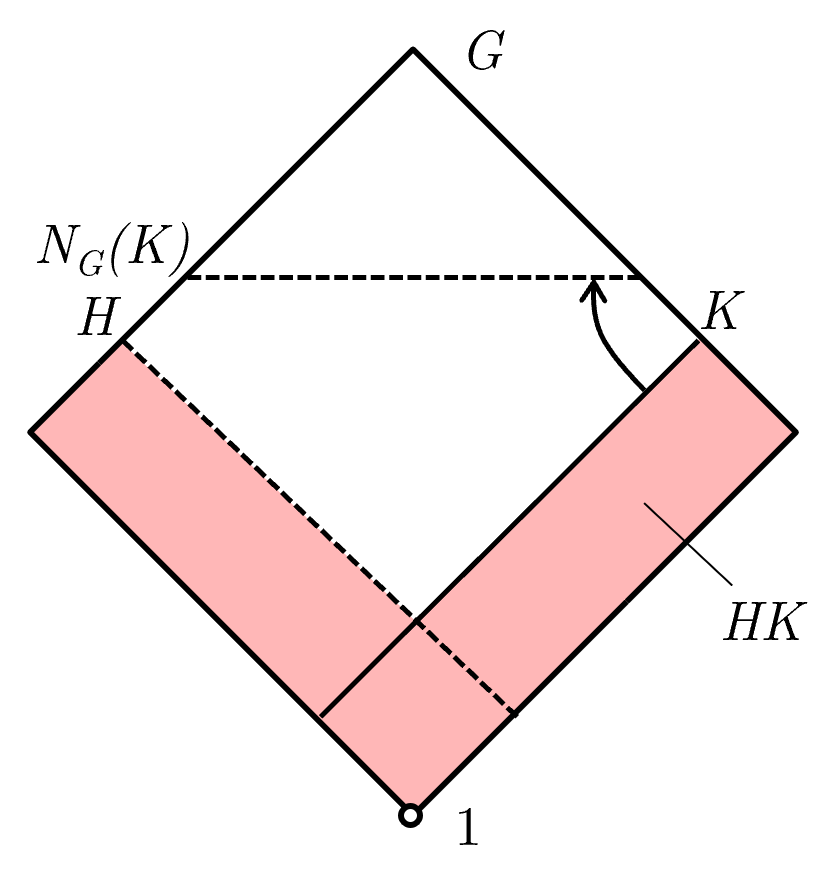
Oh! One more! Let's visually represent $HK$ for subgroups $H$ and $K$ in $G$ such that $H \le N_G(K)$. Note that $H \le N_G(K)$ implies that $HK$ is a subgroup of $G$, so that we can still represent $HK$ in our visuals. Now, this is a stronger requirement for $HK$ to be a subgroup than the sufficient requirement that $HK = KH$ ($HK = KH$ iff $HK$ is a subgroup of $G$), but since our visual is going to rely on the Diamond Isomorphism Theorem, I'll leave the case of the weaker requirement $HK = KH$ as future work (I'm lazy). Otherwise, since $H \le N_G(K)$ implies $HK = KH$, our representation of $HK$ has to be symmetrical with respect to $H$ and $K$. We will visually represent $HK$ as the union of the shapes $H$ and $K$, which makes sense as $HK$ is the smallest subgroup that contains both $H$ and $K$:
As mentioned earlier, whatever representation we choose for $HK$ has to obey the Diamond Isomorphism Theorem so for recap here it is again:
Diamond Isomorphism Theorem:
Let $G$ be a group and let $H$ and $K$ be subgroups of $G$, and assume $H \le N_G(K)$. Then $HK$ is a subgroup of $G$ and $K \trianglelefteq HK$, $H \cap K \trianglelefteq H$ and $HK / K \cong H / H\cap K$.
Now we can check the visual. From the visual, one can visually verify that $H \le N_G(K)$ implies both $K \trianglelefteq HK$ and $H \cap K \trianglelefteq H$. Furthermore, we can visually verify that $HK / K \cong H / H\cap K$:
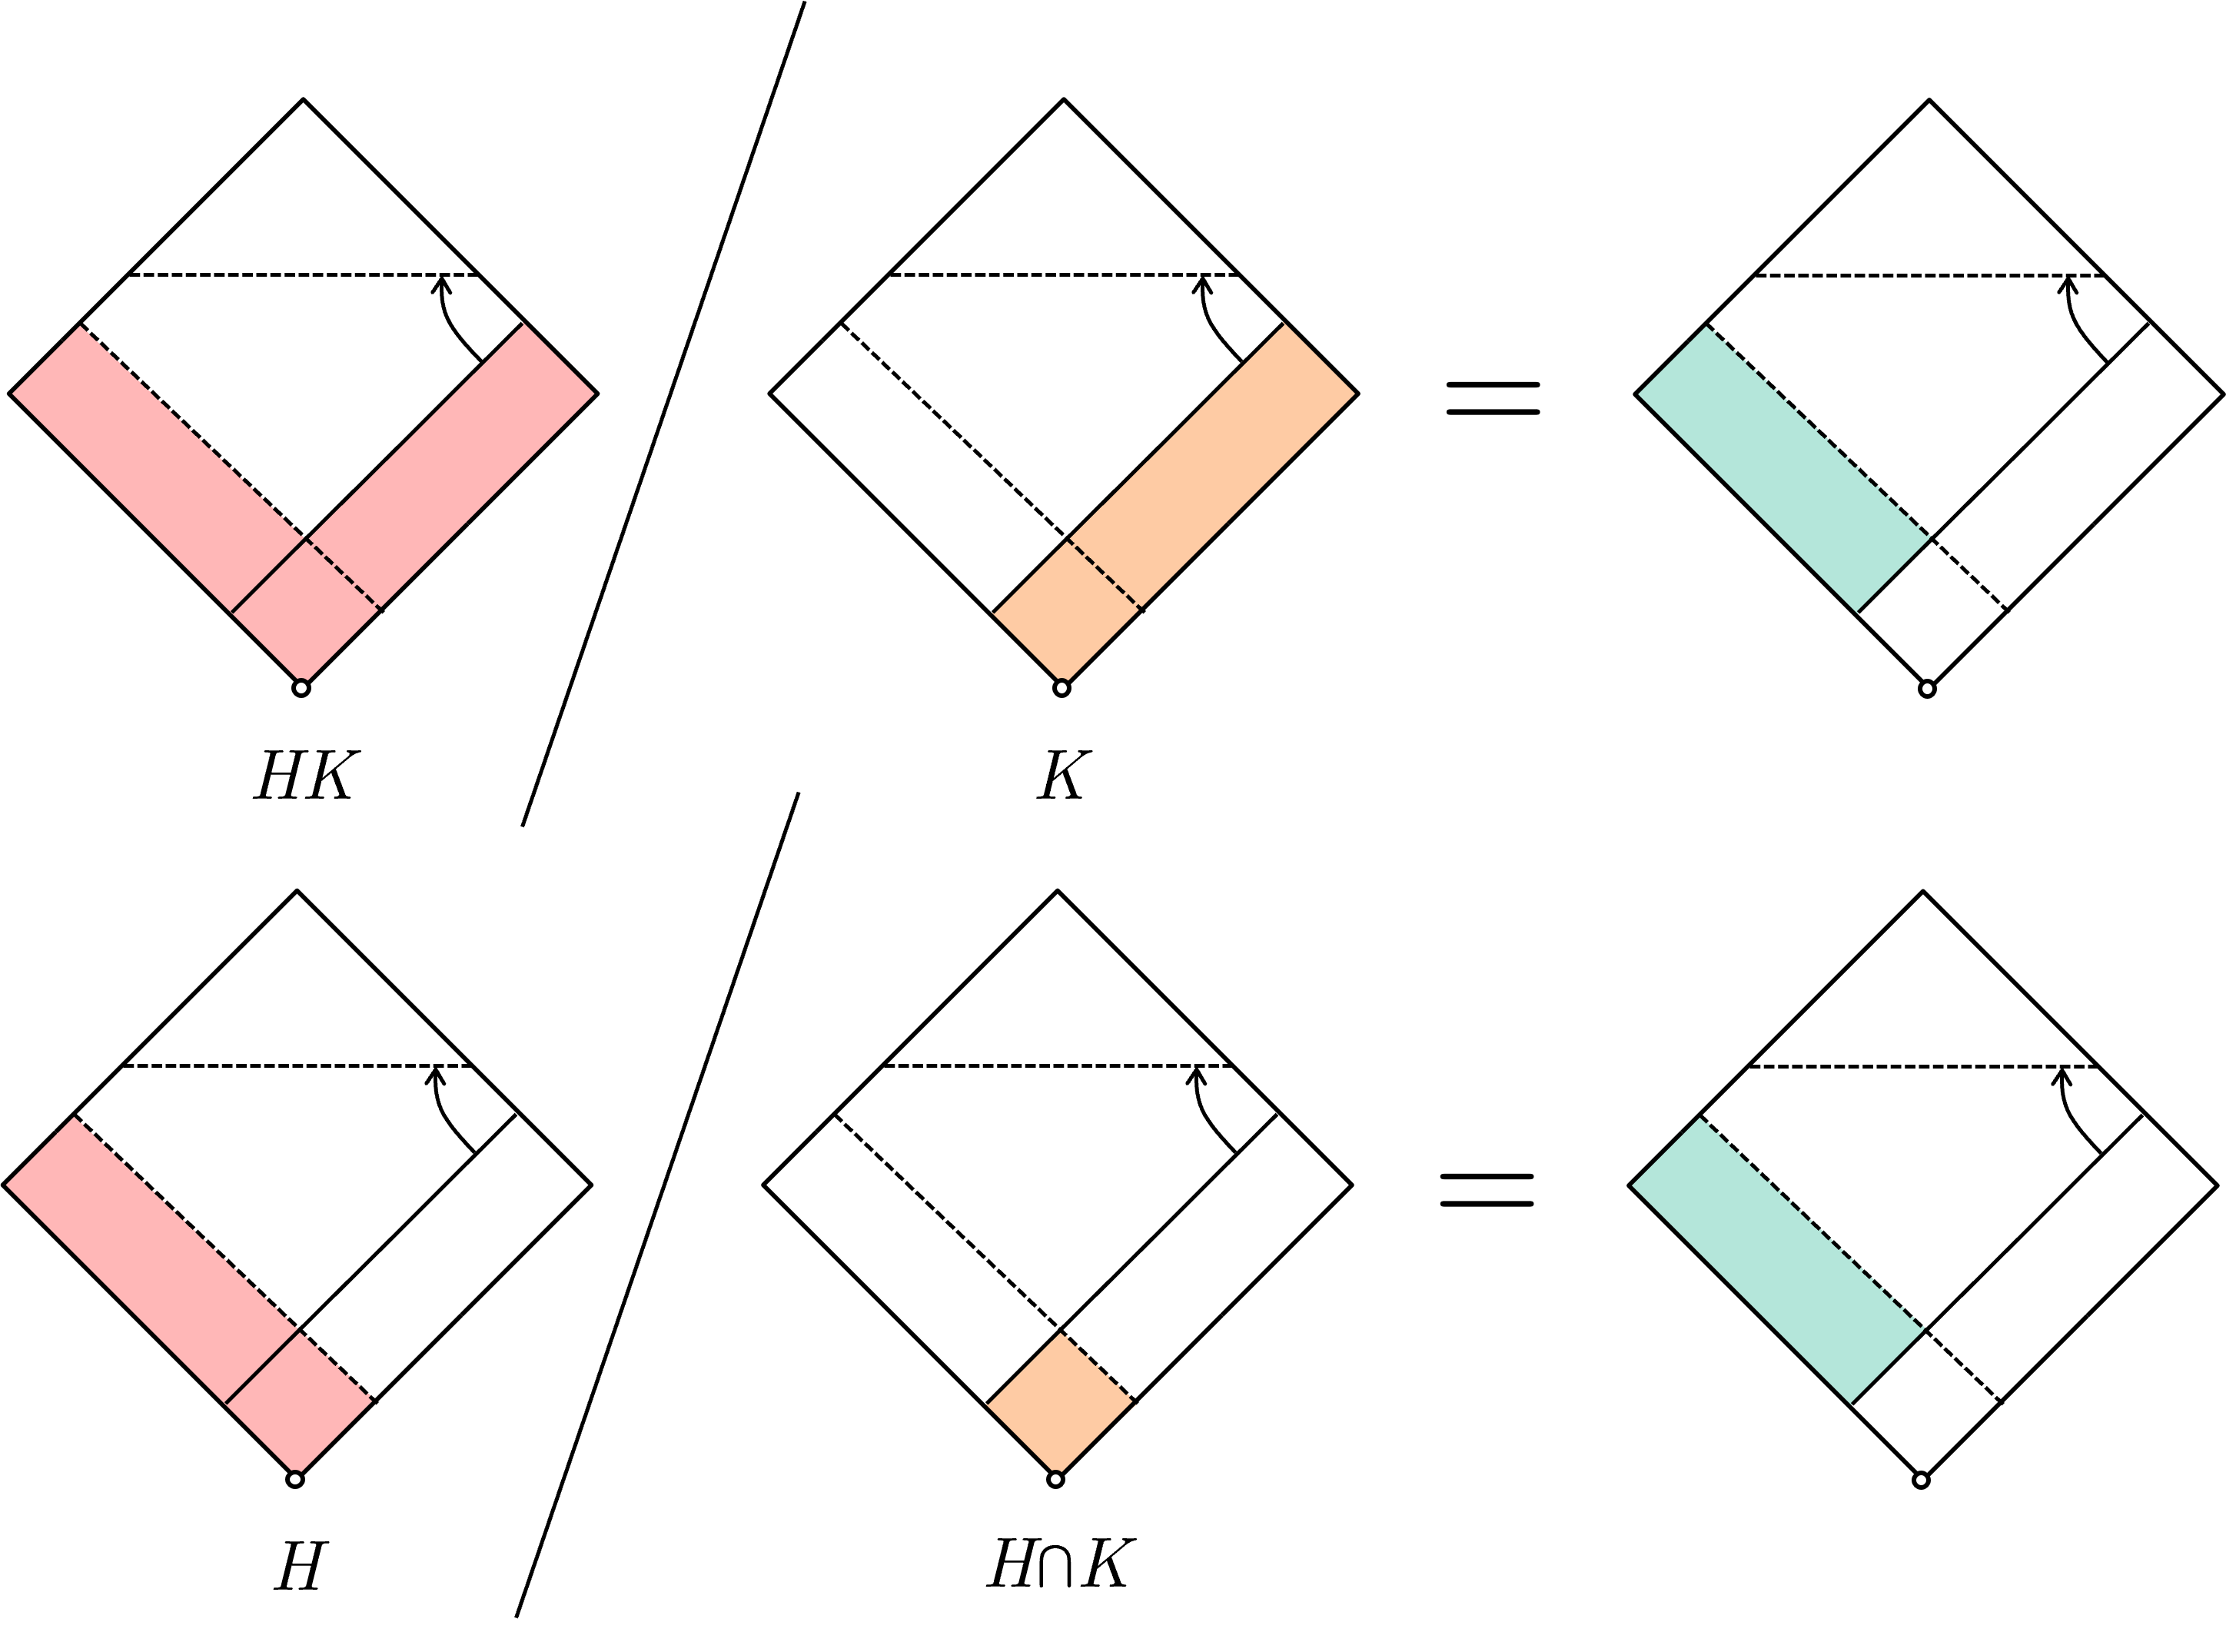
Notice that unlike the lattice visual above, $HK / K$ and $H / H\cap K$ occupies the exact same space in the diagram and we can therefore visually see that they are “equal”.
I'll be visualising more isomorphism theorems below but if you wanna you can check that this visual intuition obeys all the other isomorphism laws (really naturally too!).
Applications
Isomorphism Theorems Visualised
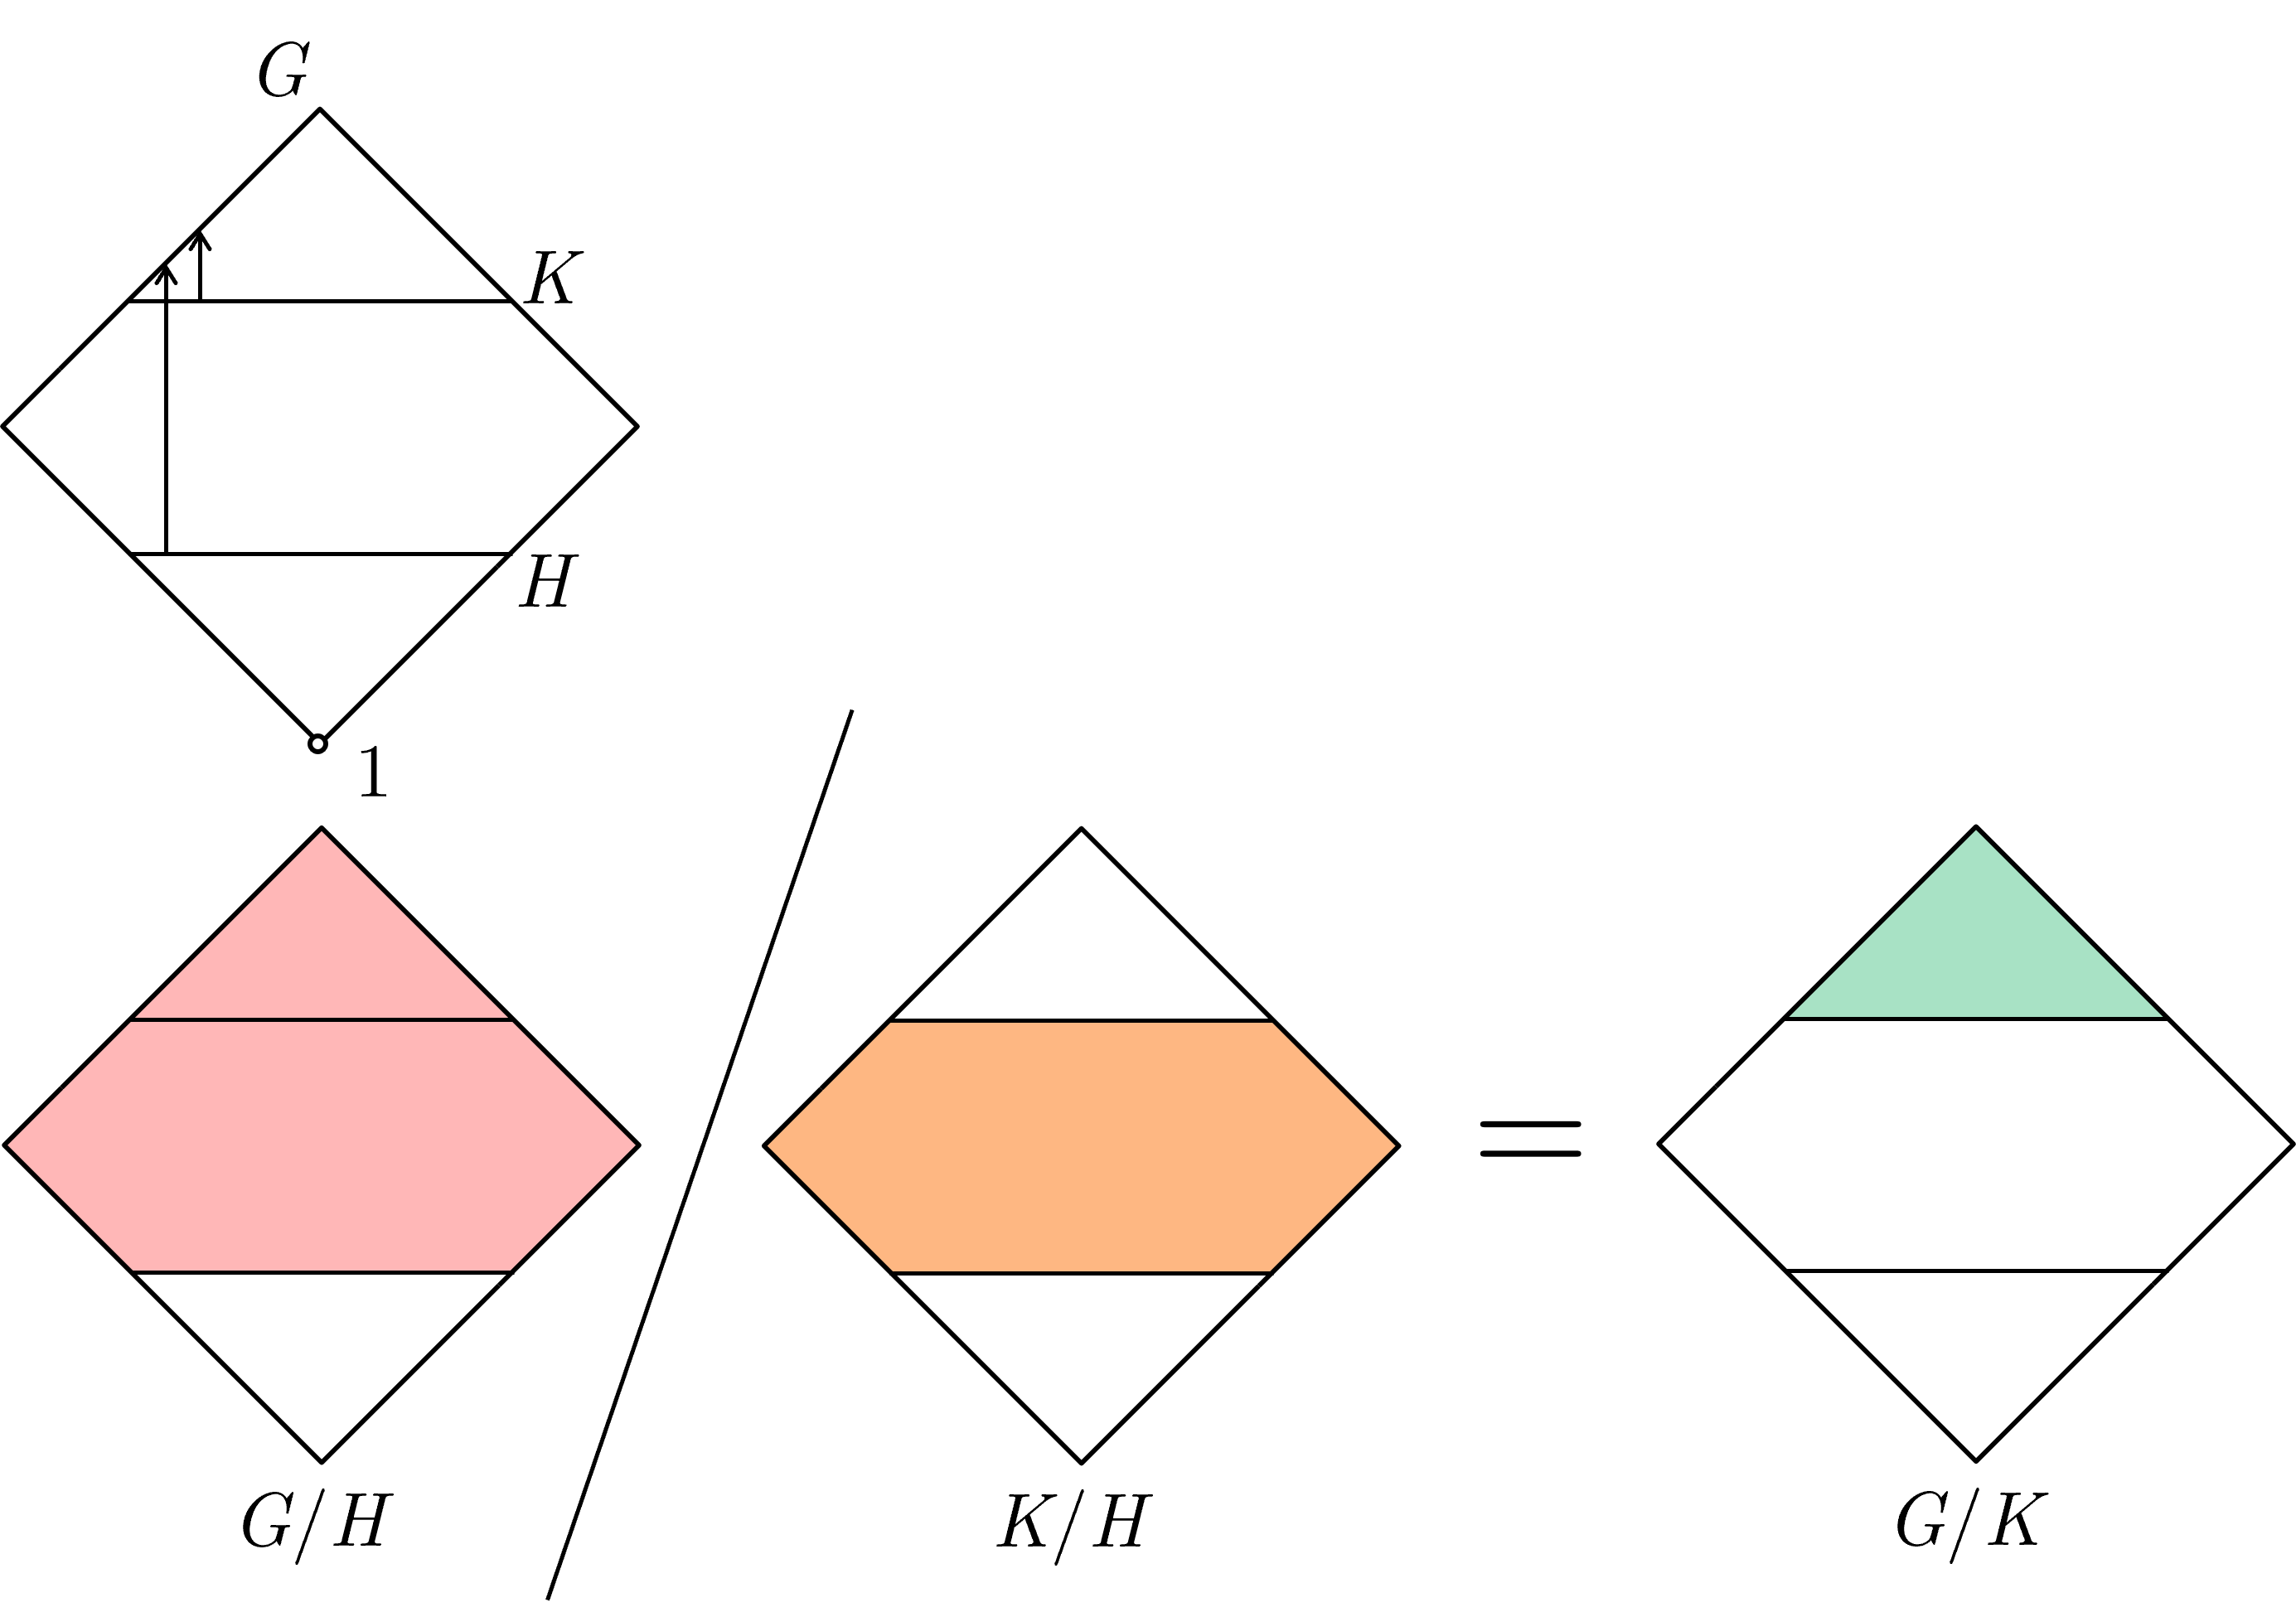
Alright let's put this intuition to good use! We'll first start simple and visualise some Isomorphism Theorems. Here's the Third Isomorphism Theorem visualised:
Third Isomorphism Theorem: Let $G$ be a group and let $H$ and $K$ be normal subgroups of $G$ with $H \le K$. Then $K/H \trianglelefteq G/H$ and $(G/H)/(K/H) \cong G/K$.
Now recall that above, the Butterfly Lemma, when visualised with the lattice, looks pretty complicated. With our new visuals, the simplicity of the Butterfly Lemma becomes apparent:
Butterfly Lemma:
Let $G$ be a group with subgroups $A$ and $C$. Suppose $B \triangleleft A$ and $D \triangleleft C$ are normal subgroups. Then
\[\frac{(A\cap C)B}{(A\cap D)B} \cong \color{cyan}{\frac{A \cap C}{(A \cap D)(B \cap C)}} \cong \frac{(A\cap C)D}{(B\cap C)D}\]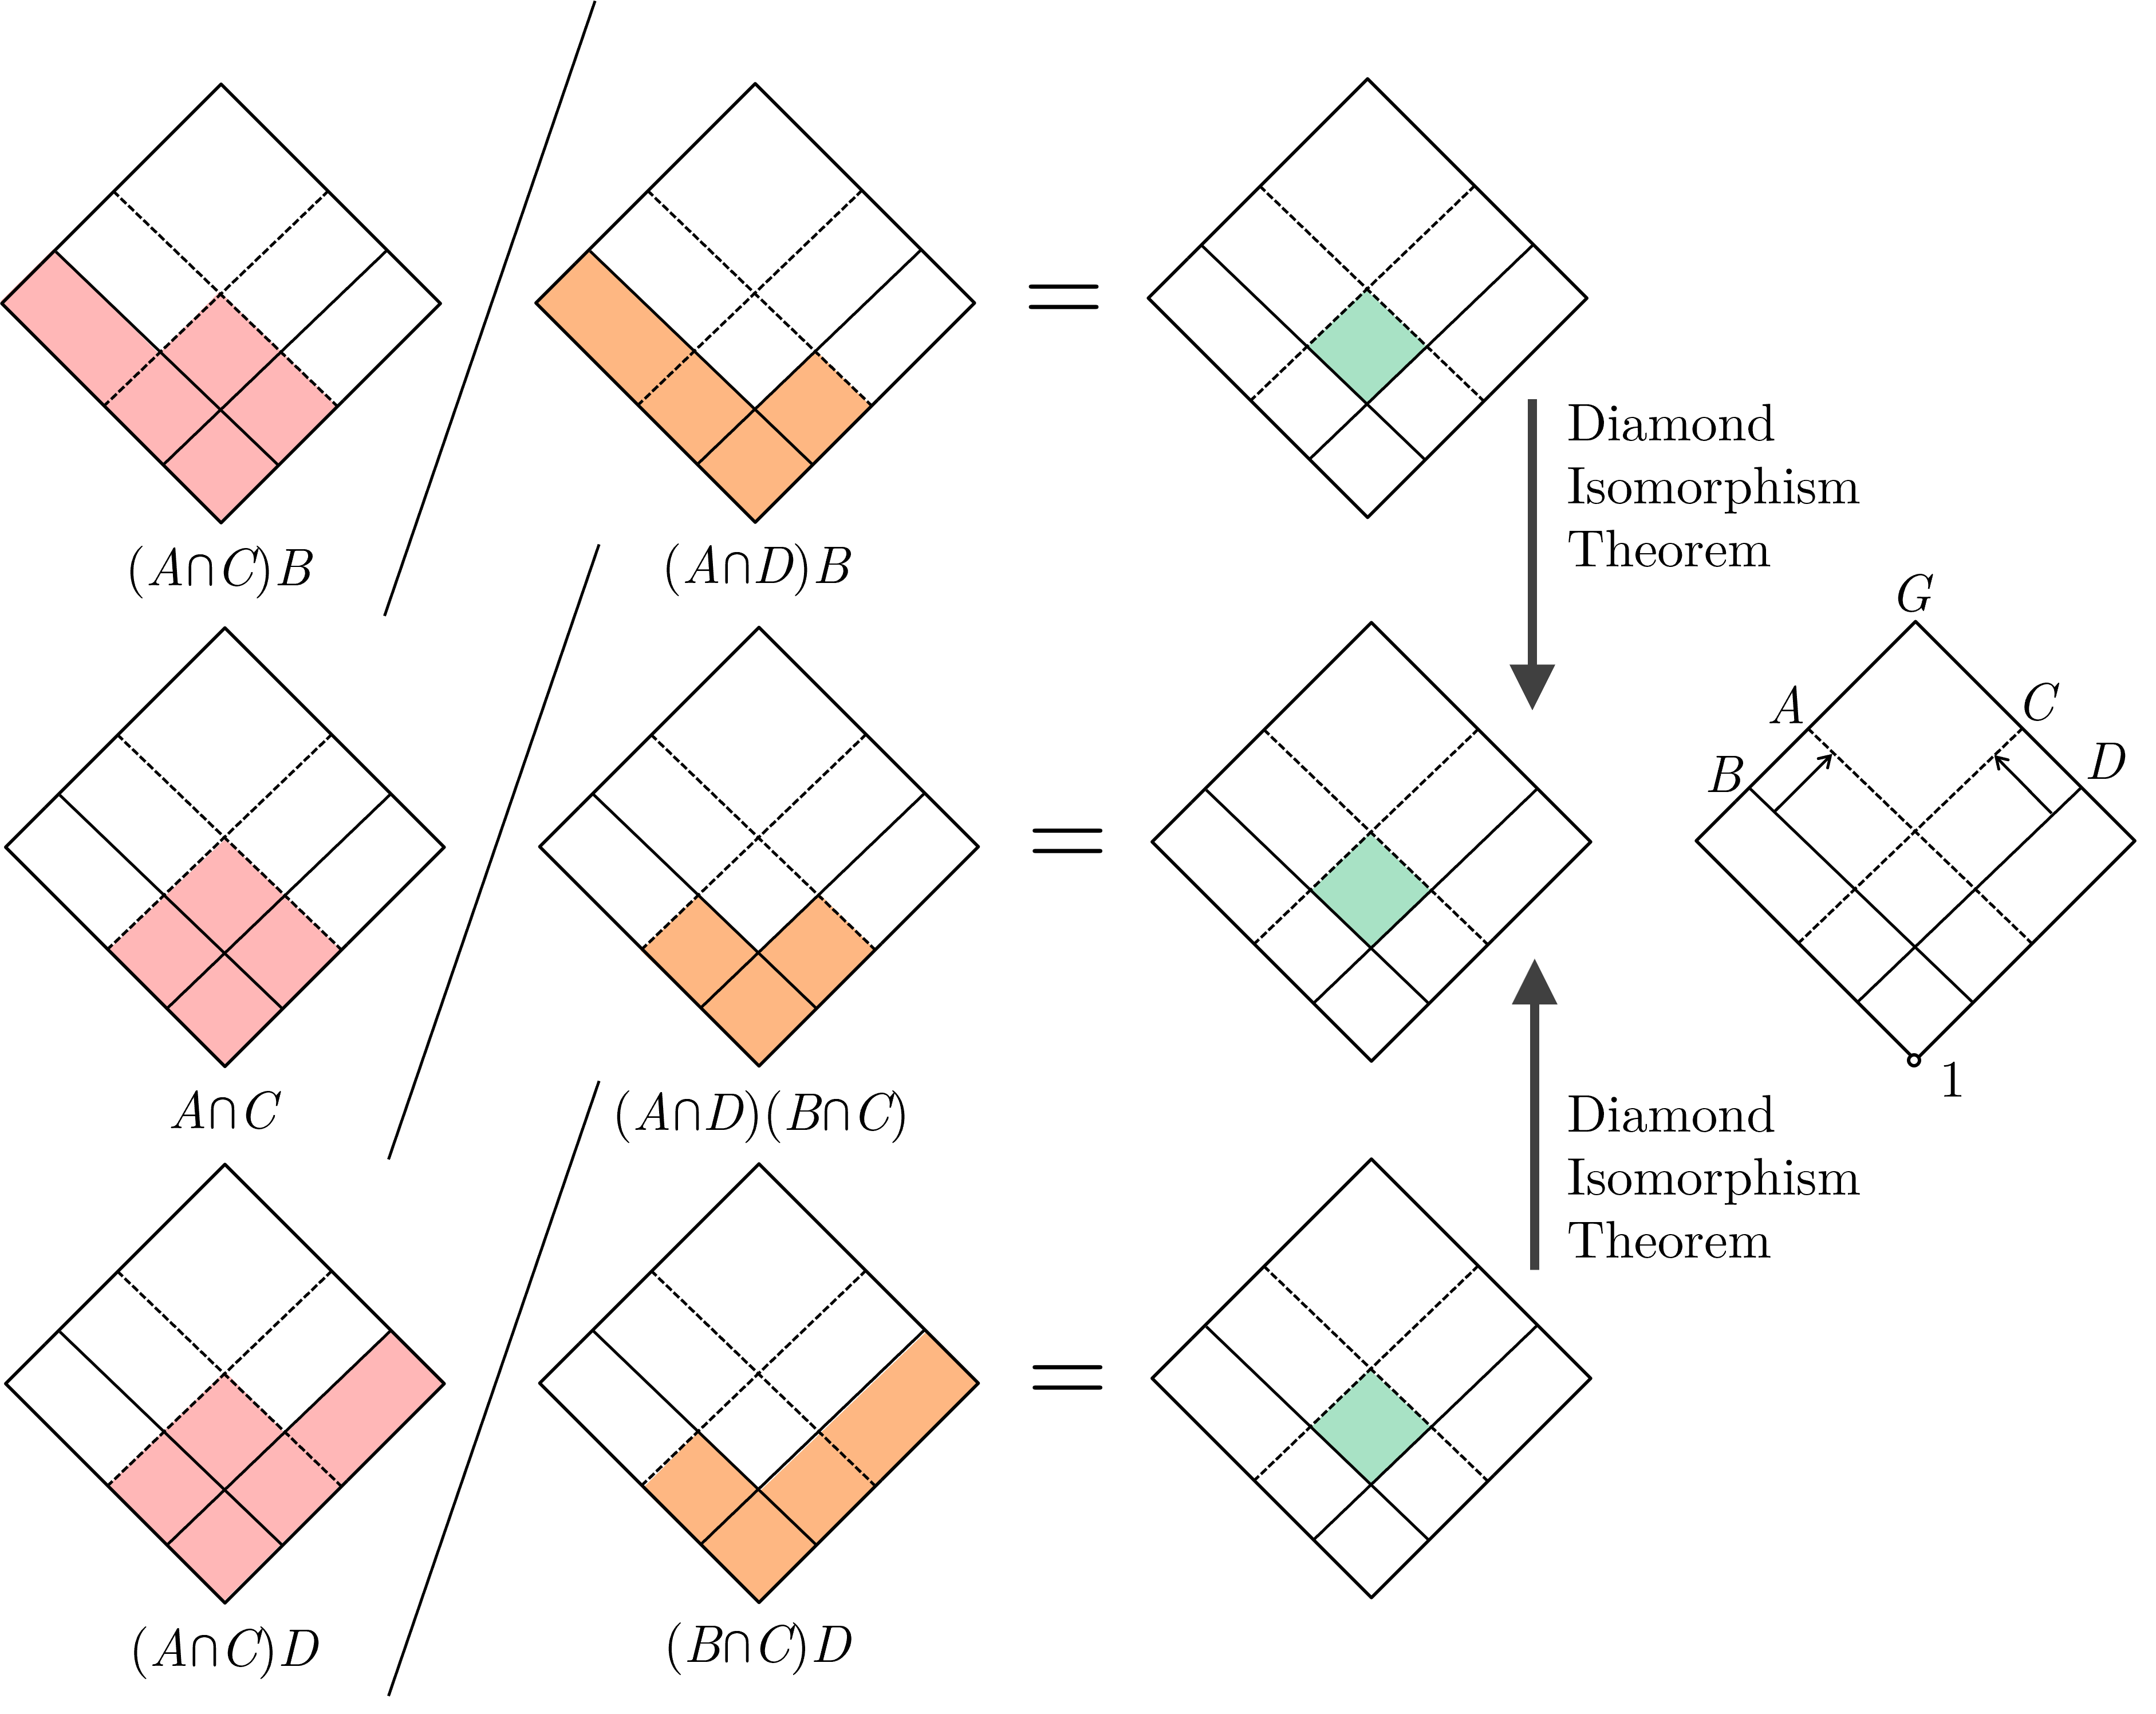
Are you able to see the Diamond Isomorphism Theorem that's used to prove the Butterfly Lemma? If not, do go back up to see how the Diamond Isomorphism Theorem looks like in our visuals.
The key benefit of using our new visuals is that we can express how different groups relate to each other without drawing new things (e.g., conversely, in the Lattice visuals $A$, $B$, $AB$ and $A\cap B$ are drawn seperately). This makes our visuals very economical. For instance, our visuals for the Butterfly Lemma is simple enough that we can visually see how it is true AND how one can go about proving it.
However, do note that there is the fundamental limitation that our visuals are in 2D and hence the amount of relationships we can capture is rather limited (e.g., try to visualise 3 different composition series of the same group with this visual. I can't, unless I move to 3D).
Subgroup Series
Composition Series
Recall that a composition series of a group $G$ is a sequence of subgroups
\[1 = N_0 \le N_1 \le \cdots \le N_{k-1} \le N_k = G\]such that $N_i \trianglelefteq N_{i+1}$ and $N_{i+1}/N_i$ is a simple group, for $0 \le i \le k-1$. $N_{i+1}/N_i$ are known as the composition factors of $G$.
For finite groups, the composition factors of $G$ are often described as analagous to the prime numbers. We can see this analogy by visualising the Jordan-Hölder Theorem:
Jordan-Hölder Theorem (Informal): Let $G$ be a finite group where $G \ne 1$. Then $G$ has a composition series. While said composition series isn't unique in general, the composition factors are unique up to permutation.
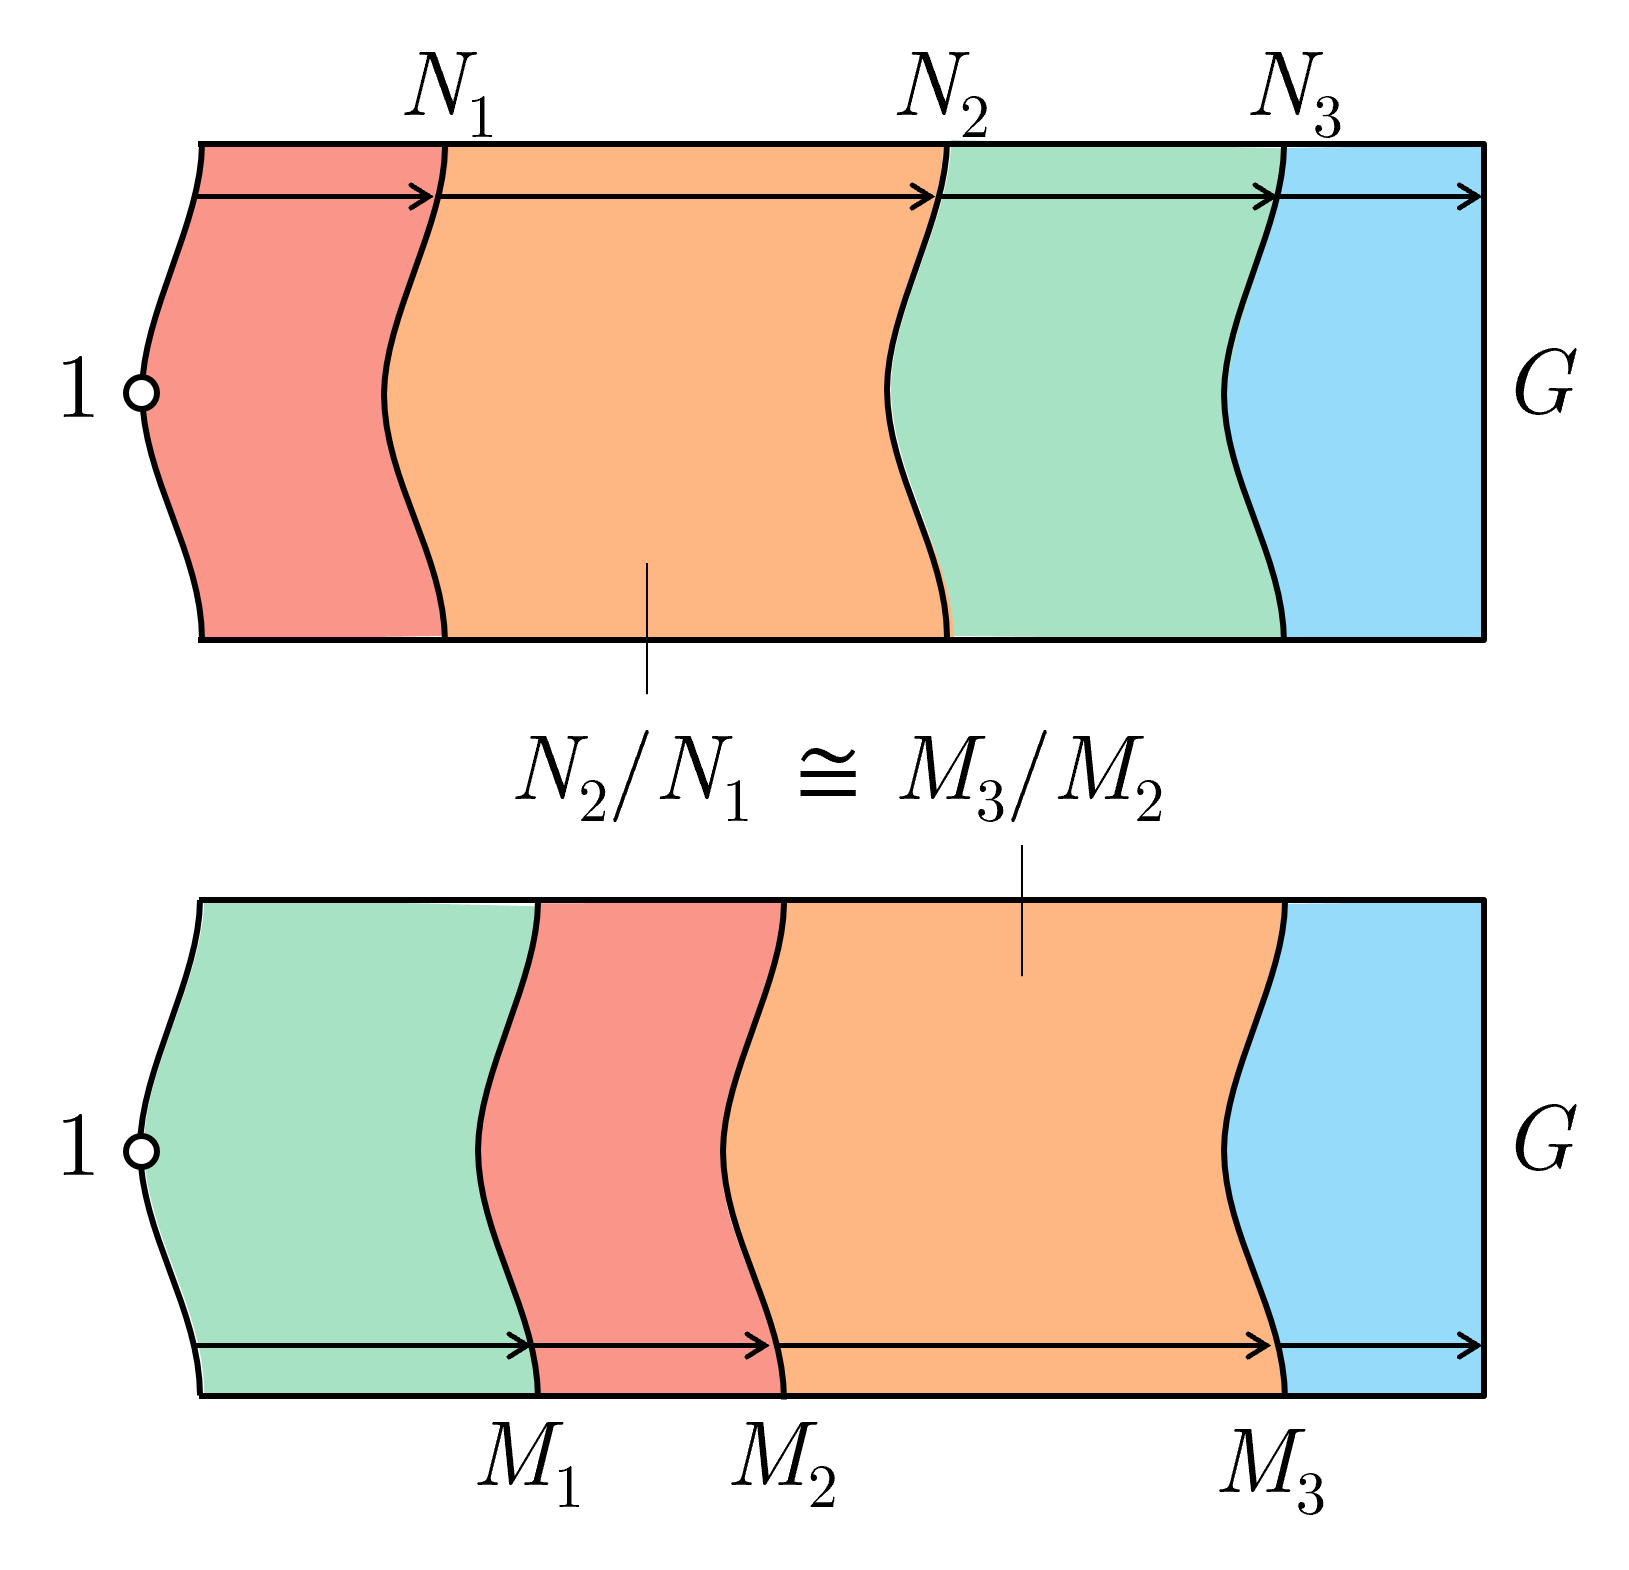
Visually, it means we can slice the shape of $G$ up into smaller regions, and no matter how we slice $G$ up, we'll always end up with the same “smaller regions”. Note that since each composition factor $N_{i+1}/N_i$ is simple, we cannot take non-trivial quotients. Visually, it means we can't slice each coloured region further.
This is analogous to the “unique factorisation” property of the natural numbers, where we can decompose a natural into irreducible prime numbers, and such decomposition over the naturals is unique.
Is there a visual way to see why the Jordan-Hölder Theorem holds? Turns out there is! I've written a follow-up post using the visual intuition built here to provide a visual proof of the Jordan-Hölder and related theorems.
Other Subgroup Series
These visuals make certain propositions seem “obvious”. For instance, when a group is Nilpotent, it has a Lower Central Series. Visually, this slices the group similarly to above into sections, and each section $G_{i+1}/G_i$ is the center of the quotient $G/G_i$. Now, we know that $p$-groups have non-trival centers, and every quotient of a $p$-group is also a $p$-group, so each of the “section”s are non-trivial. Can you see that every $p$-group is Nilpotent? Furthermore, can you see that the number of sections (the nilpotent class of the group) for a $p$-group of size $p^a$ has a maximum of $a-1$ (which happens when each factor group is of size $p$)?
Similarly, for a Solvable Group $G$, where we have each factor group $G_{i+1}/G_i$ be abelian, one can visually see that if $H \trianglelefteq G$ and $G/H$ is solvable, then $G$ is solvable. In fact, one can visually see that if $H$ has a solvable length $< h$ and $G/H$ has a solvable length of $< q$, then $G$ has a solvable length of $< h + q$.
Conversely, we can also visually see that if $G$ is solvable, and $H \trianglelefteq G$, then $H$ and $G/H$ is solvable too!
Of course, the visuals aren't everything. E.g., One would have to verify, for instance, that each section of $G/H$ is well-defined and abelian.
A fun exercise would be to try to visualise the Commutator Series of a group $G$ with relation to any one of its series with abelian factor groups. In particular, that the Solvable Length of $G$ is well-defined (always the same regardless of the series one picks for $G$), and that in some sense, the Commutator Series is the “fastest descending” series for $G$.
Abelian Groups and Other Abelian Things
For abelian groups, every subgroup is going to be normal, so there's no more need to draw the arrows ever! However, we still do need to indicate a direction somehow (a flow from the subgroup to the quotients, we don't ever want to confuse those two!). Why not draw our “slice” with a tiny wedge to indicate direction?
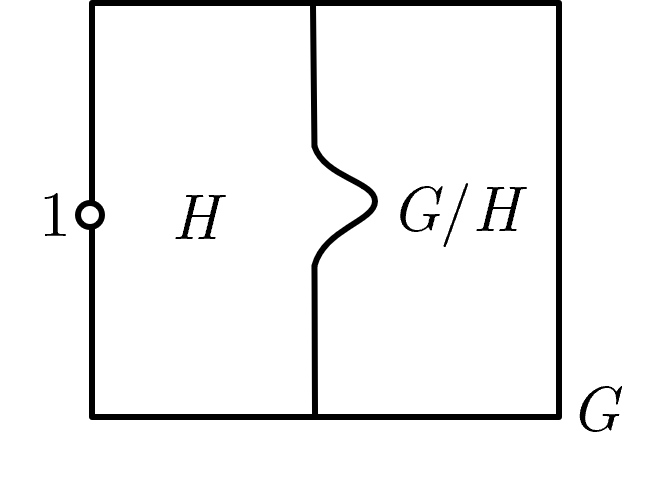
Well I'm not the first to come up with this! Puzzling Through Exact Sequence starts with this specialisation of our visuals that we build here specifically for abelian things and took that intuition really far. Highly recommend reading that.
Turns out whatever we've been building in this post is a generalisation of Puzzling Through Exact Sequence's intuition! Which hints that the intuition presented in this post could potentially be used for other algebraic objects.